| Full name: sphingomyelin phosphodiesterase 1 | Alias Symbol: ASM | ||
| Type: protein-coding gene | Cytoband: 11p15.4 | ||
| Entrez ID: 6609 | HGNC ID: HGNC:11120 | Ensembl Gene: ENSG00000166311 | OMIM ID: 607608 |
SMPD1 involved pathways:
| KEGG pathway | Description | View |
|---|---|---|
| hsa04071 | Sphingolipid signaling pathway |
Expression of SMPD1:
| Dataset | Gene | EntrezID | Probe | Log2FC | Adj.pValue | Expression |
|---|---|---|---|---|---|---|
| GSE17351 | SMPD1 | 6609 | 209420_s_at | -0.4331 | 0.3569 | |
| GSE20347 | SMPD1 | 6609 | 209420_s_at | -0.6534 | 0.0000 | |
| GSE23400 | SMPD1 | 6609 | 209420_s_at | -0.4183 | 0.0000 | |
| GSE26886 | SMPD1 | 6609 | 209420_s_at | -0.5444 | 0.0441 | |
| GSE29001 | SMPD1 | 6609 | 209420_s_at | -0.7762 | 0.0000 | |
| GSE38129 | SMPD1 | 6609 | 209420_s_at | -0.6286 | 0.0000 | |
| GSE45670 | SMPD1 | 6609 | 209420_s_at | -0.4077 | 0.0198 | |
| GSE53622 | SMPD1 | 6609 | 22137 | -0.2888 | 0.0000 | |
| GSE53624 | SMPD1 | 6609 | 22137 | -0.4751 | 0.0000 | |
| GSE63941 | SMPD1 | 6609 | 209420_s_at | -3.7987 | 0.0000 | |
| GSE77861 | SMPD1 | 6609 | 209420_s_at | -0.4643 | 0.0266 | |
| GSE97050 | SMPD1 | 6609 | A_23_P203488 | -0.0754 | 0.7770 | |
| SRP007169 | SMPD1 | 6609 | RNAseq | -1.9370 | 0.0002 | |
| SRP008496 | SMPD1 | 6609 | RNAseq | -1.3778 | 0.0002 | |
| SRP064894 | SMPD1 | 6609 | RNAseq | -0.5394 | 0.0477 | |
| SRP133303 | SMPD1 | 6609 | RNAseq | -0.4010 | 0.0169 | |
| SRP159526 | SMPD1 | 6609 | RNAseq | -0.6635 | 0.0037 | |
| SRP193095 | SMPD1 | 6609 | RNAseq | -0.7764 | 0.0000 | |
| SRP219564 | SMPD1 | 6609 | RNAseq | -0.0398 | 0.9223 | |
| TCGA | SMPD1 | 6609 | RNAseq | -0.3188 | 0.0000 |
Upregulated datasets: 0; Downregulated datasets: 3.
Survival by SMPD1 expression:
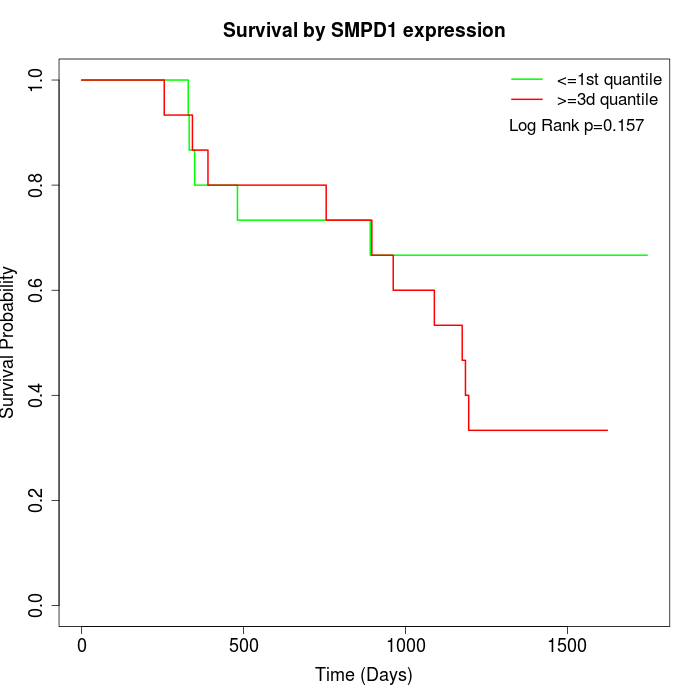 | 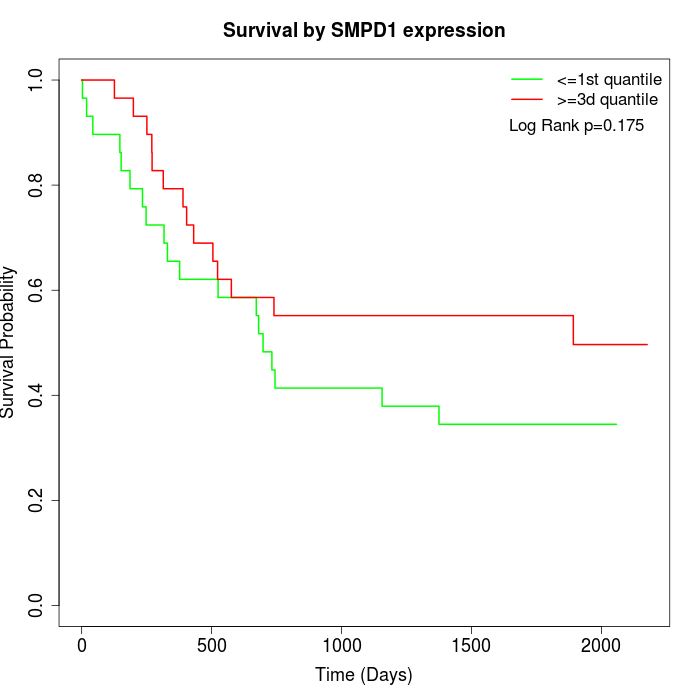 | 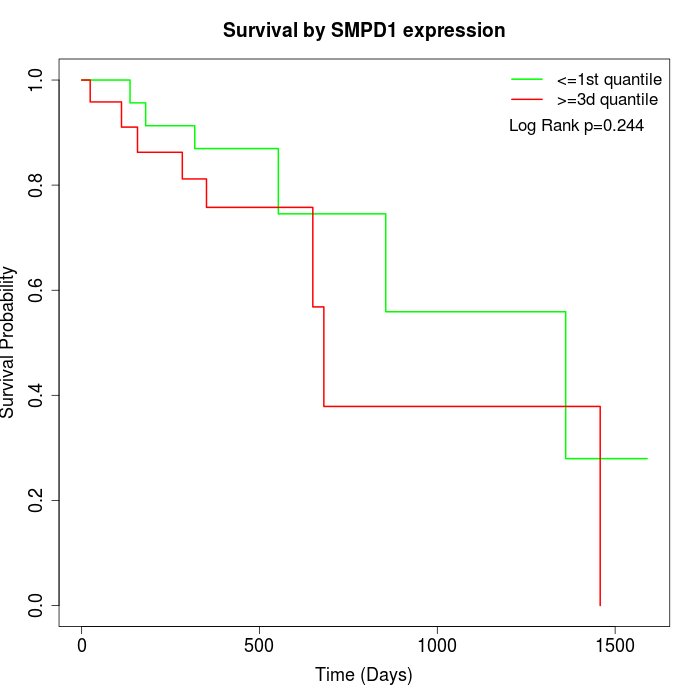 |
| GSE53622 | GSE53624 | TCGA |
Note: Click image to view full size file.
Copy number change of SMPD1:
| Dataset | Gene | EntrezID | Gain | Loss | Normal | Detail |
|---|---|---|---|---|---|---|
| GSE15526 | SMPD1 | 6609 | 1 | 11 | 18 | |
| GSE20123 | SMPD1 | 6609 | 1 | 11 | 18 | |
| GSE43470 | SMPD1 | 6609 | 1 | 8 | 34 | |
| GSE46452 | SMPD1 | 6609 | 7 | 8 | 44 | |
| GSE47630 | SMPD1 | 6609 | 2 | 12 | 26 | |
| GSE54993 | SMPD1 | 6609 | 3 | 1 | 66 | |
| GSE54994 | SMPD1 | 6609 | 2 | 12 | 39 | |
| GSE60625 | SMPD1 | 6609 | 0 | 0 | 11 | |
| GSE74703 | SMPD1 | 6609 | 1 | 6 | 29 | |
| GSE74704 | SMPD1 | 6609 | 0 | 8 | 12 | |
| TCGA | SMPD1 | 6609 | 8 | 39 | 49 |
Total number of gains: 26; Total number of losses: 116; Total Number of normals: 346.
Somatic mutations of SMPD1:
Generating mutation plots.
Highly correlated genes for SMPD1:
Showing top 20/1263 corelated genes with mean PCC>0.5.
| Gene1 | Gene2 | Mean PCC | Num. Datasets | Num. PCC<0 | Num. PCC>0.5 |
|---|---|---|---|---|---|
| SMPD1 | CNRIP1 | 0.905205 | 3 | 0 | 3 |
| SMPD1 | ZNF521 | 0.87242 | 3 | 0 | 3 |
| SMPD1 | KRTAP19-2 | 0.839855 | 3 | 0 | 3 |
| SMPD1 | DSEL | 0.833124 | 3 | 0 | 3 |
| SMPD1 | TNFRSF19 | 0.814517 | 3 | 0 | 3 |
| SMPD1 | EBF1 | 0.805709 | 3 | 0 | 3 |
| SMPD1 | ST6GALNAC3 | 0.794179 | 3 | 0 | 3 |
| SMPD1 | COL15A1 | 0.789173 | 4 | 0 | 4 |
| SMPD1 | PRADC1 | 0.788945 | 3 | 0 | 3 |
| SMPD1 | GNG2 | 0.784649 | 3 | 0 | 3 |
| SMPD1 | ARHGAP31 | 0.782811 | 4 | 0 | 3 |
| SMPD1 | FGF7 | 0.782603 | 4 | 0 | 4 |
| SMPD1 | ATL1 | 0.782332 | 3 | 0 | 3 |
| SMPD1 | RSPO3 | 0.776911 | 3 | 0 | 3 |
| SMPD1 | ZEB2 | 0.774823 | 4 | 0 | 4 |
| SMPD1 | MRAS | 0.770043 | 3 | 0 | 3 |
| SMPD1 | ZNF382 | 0.768803 | 3 | 0 | 3 |
| SMPD1 | TGFBR2 | 0.767314 | 3 | 0 | 3 |
| SMPD1 | A2M | 0.767083 | 4 | 0 | 4 |
| SMPD1 | FIBIN | 0.766305 | 5 | 0 | 4 |
For details and further investigation, click here