| Full name: tubulin alpha 1b | Alias Symbol: K-ALPHA-1 | ||
| Type: protein-coding gene | Cytoband: 12q13.12 | ||
| Entrez ID: 10376 | HGNC ID: HGNC:18809 | Ensembl Gene: ENSG00000123416 | OMIM ID: 602530 |
| Related drugs: BRENTUXIMAB VEDOTIN, CABAZITAXEL, COLCHICINE, CROLIBULIN, DAVUNETIDE, DOCETAXEL HYDRATE, ERIBULIN MESYLATE, FOSBRETABULIN DISODIUM, FOSBRETABULIN TROMETHAMINE, INDIBULIN... [more] | |||
TUBA1B involved pathways:
| KEGG pathway | Description | View |
|---|---|---|
| hsa04210 | Apoptosis | |
| hsa05130 | Pathogenic Escherichia coli infection |
Expression of TUBA1B:
| Dataset | Gene | EntrezID | Probe | Log2FC | Adj.pValue | Expression |
|---|---|---|---|---|---|---|
| GSE17351 | TUBA1B | 10376 | 211072_x_at | 0.4476 | 0.0677 | |
| GSE20347 | TUBA1B | 10376 | 211058_x_at | 0.5152 | 0.0000 | |
| GSE23400 | TUBA1B | 10376 | 212639_x_at | 0.4029 | 0.0000 | |
| GSE26886 | TUBA1B | 10376 | 211072_x_at | 0.0917 | 0.5717 | |
| GSE29001 | TUBA1B | 10376 | 211072_x_at | 0.1956 | 0.4262 | |
| GSE38129 | TUBA1B | 10376 | 213646_x_at | 0.5605 | 0.0000 | |
| GSE45670 | TUBA1B | 10376 | 212639_x_at | 0.2802 | 0.0046 | |
| GSE63941 | TUBA1B | 10376 | 212639_x_at | 0.0944 | 0.8136 | |
| GSE77861 | TUBA1B | 10376 | 213646_x_at | 0.5297 | 0.0036 | |
| GSE97050 | TUBA1B | 10376 | A_23_P128147 | 0.3404 | 0.3394 | |
| SRP007169 | TUBA1B | 10376 | RNAseq | 0.4759 | 0.0975 | |
| SRP008496 | TUBA1B | 10376 | RNAseq | 0.4191 | 0.0460 | |
| SRP064894 | TUBA1B | 10376 | RNAseq | 1.0424 | 0.0000 | |
| SRP133303 | TUBA1B | 10376 | RNAseq | 1.0145 | 0.0000 | |
| SRP159526 | TUBA1B | 10376 | RNAseq | 0.6565 | 0.0398 | |
| SRP193095 | TUBA1B | 10376 | RNAseq | 0.6801 | 0.0000 | |
| SRP219564 | TUBA1B | 10376 | RNAseq | 0.5069 | 0.3350 | |
| TCGA | TUBA1B | 10376 | RNAseq | 0.2427 | 0.0000 |
Upregulated datasets: 2; Downregulated datasets: 0.
Survival by TUBA1B expression:
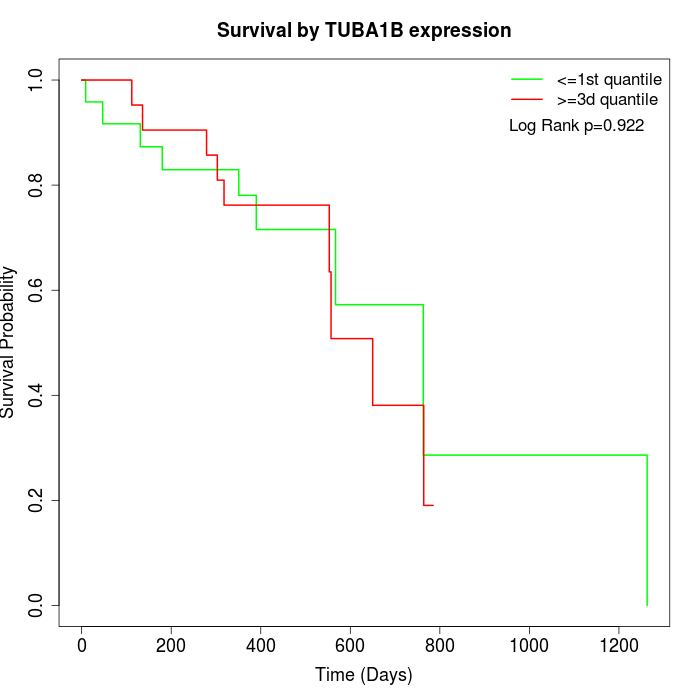 |
| TCGA |
Note: Click image to view full size file.
Copy number change of TUBA1B:
| Dataset | Gene | EntrezID | Gain | Loss | Normal | Detail |
|---|---|---|---|---|---|---|
| GSE15526 | TUBA1B | 10376 | 6 | 1 | 23 | |
| GSE20123 | TUBA1B | 10376 | 6 | 1 | 23 | |
| GSE43470 | TUBA1B | 10376 | 4 | 1 | 38 | |
| GSE46452 | TUBA1B | 10376 | 8 | 1 | 50 | |
| GSE47630 | TUBA1B | 10376 | 11 | 2 | 27 | |
| GSE54993 | TUBA1B | 10376 | 0 | 5 | 65 | |
| GSE54994 | TUBA1B | 10376 | 4 | 1 | 48 | |
| GSE60625 | TUBA1B | 10376 | 0 | 0 | 11 | |
| GSE74703 | TUBA1B | 10376 | 4 | 1 | 31 | |
| GSE74704 | TUBA1B | 10376 | 4 | 1 | 15 | |
| TCGA | TUBA1B | 10376 | 16 | 13 | 67 |
Total number of gains: 63; Total number of losses: 27; Total Number of normals: 398.
Somatic mutations of TUBA1B:
Generating mutation plots.
Highly correlated genes for TUBA1B:
Showing top 20/2016 corelated genes with mean PCC>0.5.
| Gene1 | Gene2 | Mean PCC | Num. Datasets | Num. PCC<0 | Num. PCC>0.5 |
|---|---|---|---|---|---|
| TUBA1B | IRF2BPL | 0.879137 | 3 | 0 | 3 |
| TUBA1B | TUBA1C | 0.877721 | 10 | 0 | 9 |
| TUBA1B | CPT1A | 0.825114 | 3 | 0 | 3 |
| TUBA1B | MRPS26 | 0.8129 | 3 | 0 | 3 |
| TUBA1B | BRI3 | 0.80949 | 3 | 0 | 3 |
| TUBA1B | TTL | 0.804472 | 4 | 0 | 4 |
| TUBA1B | CERS2 | 0.794183 | 7 | 0 | 7 |
| TUBA1B | CRTC2 | 0.790205 | 3 | 0 | 3 |
| TUBA1B | PSMG3 | 0.786404 | 4 | 0 | 4 |
| TUBA1B | ELOF1 | 0.786238 | 4 | 0 | 4 |
| TUBA1B | RAVER1 | 0.782177 | 4 | 0 | 3 |
| TUBA1B | NAV1 | 0.774722 | 3 | 0 | 3 |
| TUBA1B | TMEM184B | 0.772332 | 7 | 0 | 7 |
| TUBA1B | FBLIM1 | 0.769594 | 4 | 0 | 4 |
| TUBA1B | RPF2 | 0.76929 | 3 | 0 | 3 |
| TUBA1B | B3GALT6 | 0.768718 | 3 | 0 | 3 |
| TUBA1B | ZBTB9 | 0.76624 | 3 | 0 | 3 |
| TUBA1B | SAMD1 | 0.764513 | 3 | 0 | 3 |
| TUBA1B | YWHAG | 0.763645 | 4 | 0 | 4 |
| TUBA1B | DNAH14 | 0.761846 | 4 | 0 | 4 |
For details and further investigation, click here