| Full name: chitobiase | Alias Symbol: | ||
| Type: protein-coding gene | Cytoband: 1p22.3 | ||
| Entrez ID: 1486 | HGNC ID: HGNC:2496 | Ensembl Gene: ENSG00000117151 | OMIM ID: 600873 |
Expression of CTBS:
| Dataset | Gene | EntrezID | Probe | Log2FC | Adj.pValue | Expression |
|---|---|---|---|---|---|---|
| GSE17351 | CTBS | 1486 | 218924_s_at | -0.0520 | 0.9518 | |
| GSE20347 | CTBS | 1486 | 218924_s_at | -0.5827 | 0.0001 | |
| GSE23400 | CTBS | 1486 | 218924_s_at | -0.0119 | 0.8790 | |
| GSE26886 | CTBS | 1486 | 218923_at | -0.9674 | 0.0035 | |
| GSE29001 | CTBS | 1486 | 218924_s_at | -0.3919 | 0.2473 | |
| GSE38129 | CTBS | 1486 | 218924_s_at | -0.2442 | 0.1500 | |
| GSE45670 | CTBS | 1486 | 218924_s_at | -0.0829 | 0.7940 | |
| GSE53622 | CTBS | 1486 | 80414 | -0.2014 | 0.0045 | |
| GSE53624 | CTBS | 1486 | 80414 | -0.3478 | 0.0000 | |
| GSE63941 | CTBS | 1486 | 218924_s_at | -0.1019 | 0.8712 | |
| GSE77861 | CTBS | 1486 | 218924_s_at | -0.5046 | 0.1871 | |
| GSE97050 | CTBS | 1486 | A_23_P201368 | 0.0716 | 0.8194 | |
| SRP007169 | CTBS | 1486 | RNAseq | -1.3532 | 0.0002 | |
| SRP008496 | CTBS | 1486 | RNAseq | -0.8605 | 0.0004 | |
| SRP064894 | CTBS | 1486 | RNAseq | -0.1575 | 0.4131 | |
| SRP133303 | CTBS | 1486 | RNAseq | -0.1056 | 0.5421 | |
| SRP159526 | CTBS | 1486 | RNAseq | -0.4710 | 0.1225 | |
| SRP193095 | CTBS | 1486 | RNAseq | -0.5175 | 0.0000 | |
| SRP219564 | CTBS | 1486 | RNAseq | 0.0437 | 0.9028 | |
| TCGA | CTBS | 1486 | RNAseq | -0.1813 | 0.0010 |
Upregulated datasets: 0; Downregulated datasets: 1.
Survival by CTBS expression:
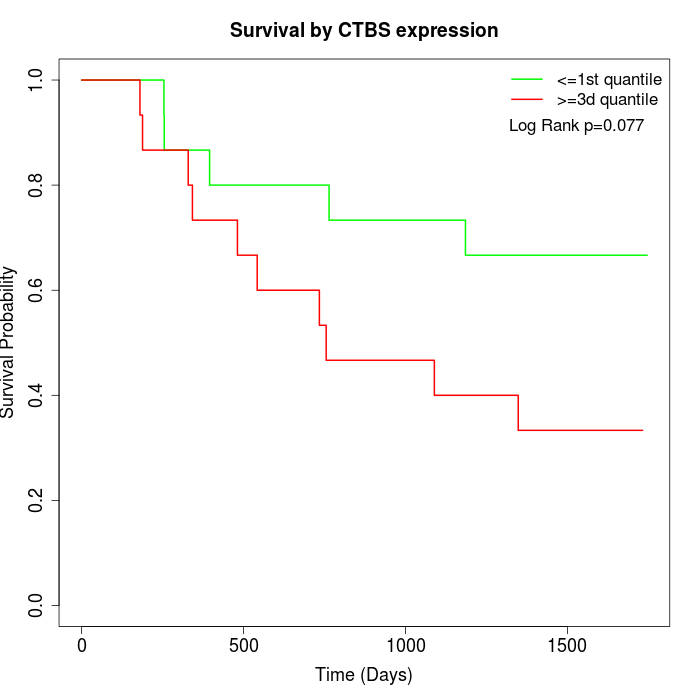 | 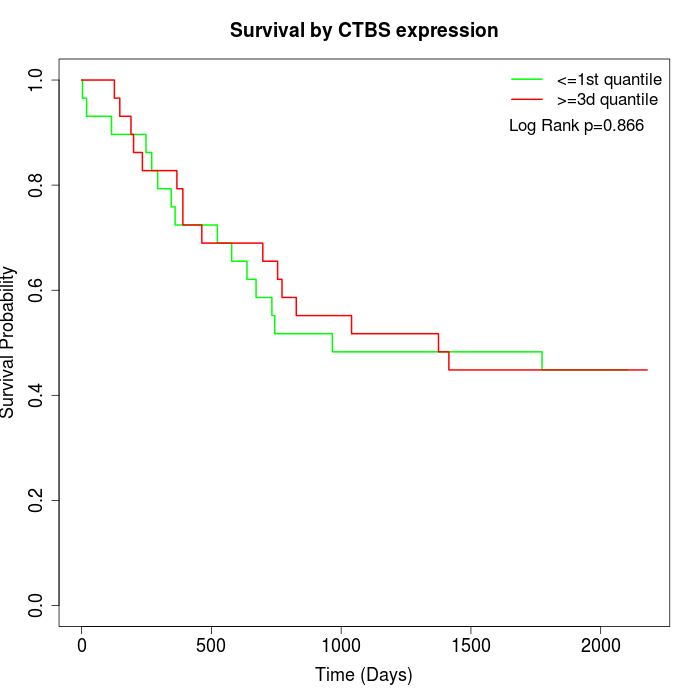 | 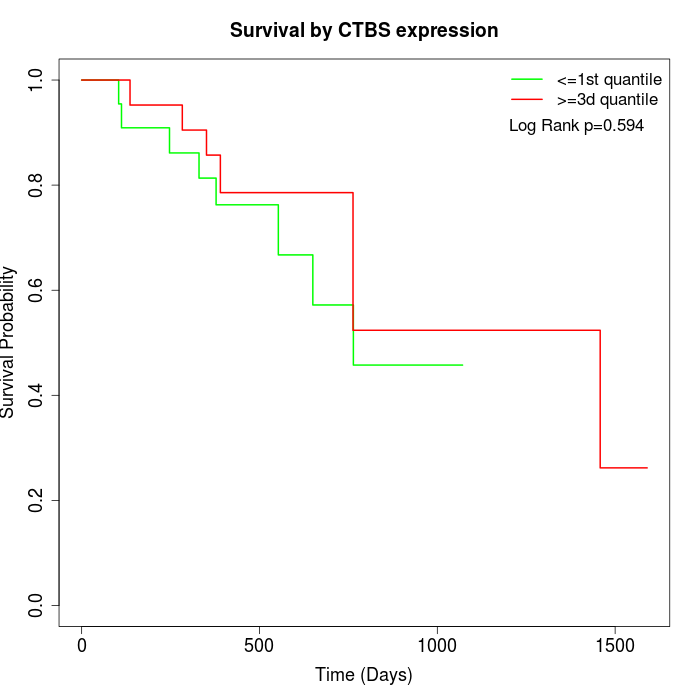 |
| GSE53622 | GSE53624 | TCGA |
Note: Click image to view full size file.
Copy number change of CTBS:
| Dataset | Gene | EntrezID | Gain | Loss | Normal | Detail |
|---|---|---|---|---|---|---|
| GSE15526 | CTBS | 1486 | 0 | 8 | 22 | |
| GSE20123 | CTBS | 1486 | 0 | 8 | 22 | |
| GSE43470 | CTBS | 1486 | 2 | 2 | 39 | |
| GSE46452 | CTBS | 1486 | 0 | 1 | 58 | |
| GSE47630 | CTBS | 1486 | 8 | 5 | 27 | |
| GSE54993 | CTBS | 1486 | 0 | 0 | 70 | |
| GSE54994 | CTBS | 1486 | 6 | 3 | 44 | |
| GSE60625 | CTBS | 1486 | 0 | 0 | 11 | |
| GSE74703 | CTBS | 1486 | 1 | 2 | 33 | |
| GSE74704 | CTBS | 1486 | 0 | 5 | 15 | |
| TCGA | CTBS | 1486 | 7 | 23 | 66 |
Total number of gains: 24; Total number of losses: 57; Total Number of normals: 407.
Somatic mutations of CTBS:
Generating mutation plots.
Highly correlated genes for CTBS:
Showing top 20/673 corelated genes with mean PCC>0.5.
| Gene1 | Gene2 | Mean PCC | Num. Datasets | Num. PCC<0 | Num. PCC>0.5 |
|---|---|---|---|---|---|
| CTBS | ELOVL7 | 0.768755 | 3 | 0 | 3 |
| CTBS | MTA3 | 0.760016 | 3 | 0 | 3 |
| CTBS | DHX15 | 0.750805 | 3 | 0 | 3 |
| CTBS | MLKL | 0.749961 | 4 | 0 | 4 |
| CTBS | GPBP1 | 0.743797 | 3 | 0 | 3 |
| CTBS | MBLAC2 | 0.733734 | 4 | 0 | 4 |
| CTBS | CHMP2A | 0.733658 | 3 | 0 | 3 |
| CTBS | SLC31A2 | 0.729851 | 4 | 0 | 4 |
| CTBS | MIER3 | 0.725828 | 3 | 0 | 3 |
| CTBS | TMEM167A | 0.718122 | 3 | 0 | 3 |
| CTBS | BDP1 | 0.717901 | 4 | 0 | 4 |
| CTBS | ATG2B | 0.714194 | 4 | 0 | 4 |
| CTBS | PGLS | 0.712879 | 3 | 0 | 3 |
| CTBS | EGLN1 | 0.707836 | 3 | 0 | 3 |
| CTBS | HOOK3 | 0.70117 | 3 | 0 | 3 |
| CTBS | REEP3 | 0.700854 | 3 | 0 | 3 |
| CTBS | NDST1 | 0.69982 | 3 | 0 | 3 |
| CTBS | GDAP2 | 0.699251 | 3 | 0 | 3 |
| CTBS | DLL1 | 0.696262 | 3 | 0 | 3 |
| CTBS | GABPA | 0.695544 | 4 | 0 | 4 |
For details and further investigation, click here