| Full name: N-deacetylase and N-sulfotransferase 1 | Alias Symbol: NST1 | ||
| Type: protein-coding gene | Cytoband: 5q33.1 | ||
| Entrez ID: 3340 | HGNC ID: HGNC:7680 | Ensembl Gene: ENSG00000070614 | OMIM ID: 600853 |
Screen Evidence:
| |||
Expression of NDST1:
| Dataset | Gene | EntrezID | Probe | Log2FC | Adj.pValue | Expression |
|---|---|---|---|---|---|---|
| GSE17351 | NDST1 | 3340 | 202607_at | -0.0285 | 0.9751 | |
| GSE20347 | NDST1 | 3340 | 202607_at | -0.9435 | 0.0000 | |
| GSE23400 | NDST1 | 3340 | 202607_at | -0.6485 | 0.0000 | |
| GSE26886 | NDST1 | 3340 | 1554010_at | 0.1067 | 0.8063 | |
| GSE29001 | NDST1 | 3340 | 202607_at | -0.6992 | 0.0045 | |
| GSE38129 | NDST1 | 3340 | 202607_at | -0.7160 | 0.0000 | |
| GSE45670 | NDST1 | 3340 | 202607_at | -0.0595 | 0.7423 | |
| GSE53622 | NDST1 | 3340 | 8235 | -1.3330 | 0.0000 | |
| GSE53624 | NDST1 | 3340 | 8235 | -1.0690 | 0.0000 | |
| GSE63941 | NDST1 | 3340 | 202607_at | -0.7531 | 0.1221 | |
| GSE77861 | NDST1 | 3340 | 202607_at | -0.4177 | 0.1370 | |
| GSE97050 | NDST1 | 3340 | A_33_P3300092 | -0.7486 | 0.0964 | |
| SRP007169 | NDST1 | 3340 | RNAseq | -2.7493 | 0.0000 | |
| SRP008496 | NDST1 | 3340 | RNAseq | -2.6777 | 0.0000 | |
| SRP064894 | NDST1 | 3340 | RNAseq | -0.7158 | 0.0000 | |
| SRP133303 | NDST1 | 3340 | RNAseq | -0.9429 | 0.0000 | |
| SRP159526 | NDST1 | 3340 | RNAseq | -1.2850 | 0.0001 | |
| SRP193095 | NDST1 | 3340 | RNAseq | -0.7953 | 0.0000 | |
| SRP219564 | NDST1 | 3340 | RNAseq | -0.6848 | 0.0362 | |
| TCGA | NDST1 | 3340 | RNAseq | -0.1201 | 0.0516 |
Upregulated datasets: 0; Downregulated datasets: 5.
Survival by NDST1 expression:
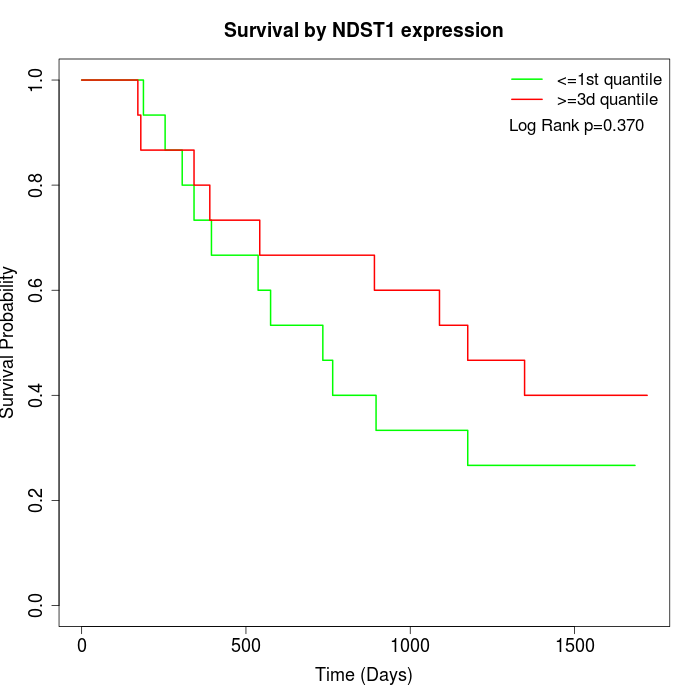 | 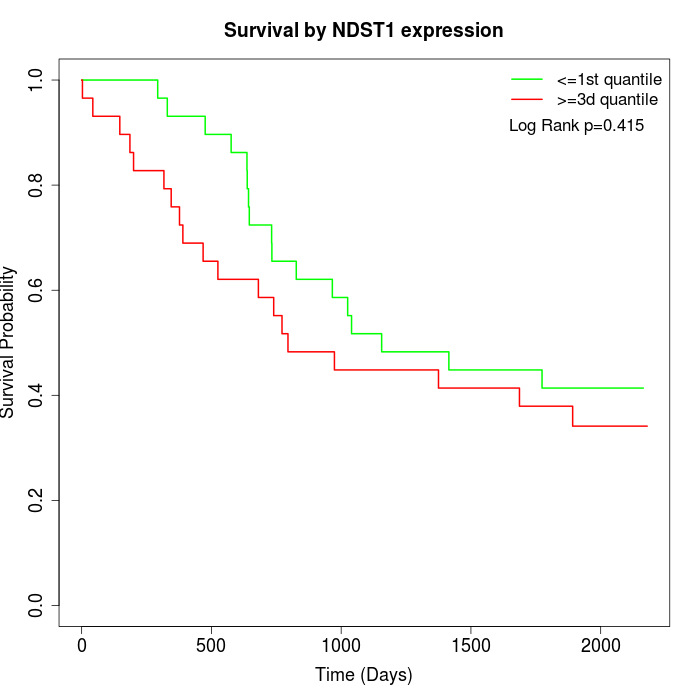 | 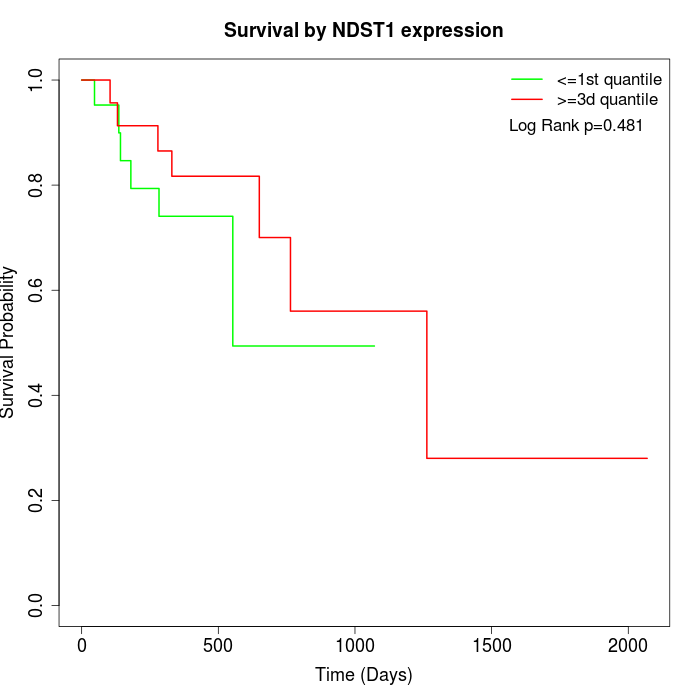 |
| GSE53622 | GSE53624 | TCGA |
Note: Click image to view full size file.
Copy number change of NDST1:
| Dataset | Gene | EntrezID | Gain | Loss | Normal | Detail |
|---|---|---|---|---|---|---|
| GSE15526 | NDST1 | 3340 | 1 | 12 | 17 | |
| GSE20123 | NDST1 | 3340 | 1 | 12 | 17 | |
| GSE43470 | NDST1 | 3340 | 1 | 10 | 32 | |
| GSE46452 | NDST1 | 3340 | 0 | 27 | 32 | |
| GSE47630 | NDST1 | 3340 | 0 | 20 | 20 | |
| GSE54993 | NDST1 | 3340 | 9 | 1 | 60 | |
| GSE54994 | NDST1 | 3340 | 2 | 15 | 36 | |
| GSE60625 | NDST1 | 3340 | 0 | 0 | 11 | |
| GSE74703 | NDST1 | 3340 | 1 | 7 | 28 | |
| GSE74704 | NDST1 | 3340 | 1 | 7 | 12 | |
| TCGA | NDST1 | 3340 | 5 | 37 | 54 |
Total number of gains: 21; Total number of losses: 148; Total Number of normals: 319.
Somatic mutations of NDST1:
Generating mutation plots.
Highly correlated genes for NDST1:
Showing top 20/1109 corelated genes with mean PCC>0.5.
| Gene1 | Gene2 | Mean PCC | Num. Datasets | Num. PCC<0 | Num. PCC>0.5 |
|---|---|---|---|---|---|
| NDST1 | MBLAC2 | 0.782072 | 3 | 0 | 3 |
| NDST1 | RMND5B | 0.766145 | 9 | 0 | 9 |
| NDST1 | DDI2 | 0.75505 | 3 | 0 | 3 |
| NDST1 | ABR | 0.748306 | 9 | 0 | 9 |
| NDST1 | TOM1 | 0.746949 | 10 | 0 | 10 |
| NDST1 | NAPA | 0.74566 | 9 | 0 | 9 |
| NDST1 | ABLIM2 | 0.744707 | 7 | 0 | 6 |
| NDST1 | ANKRD31 | 0.742576 | 4 | 0 | 4 |
| NDST1 | CCDC12 | 0.741636 | 4 | 0 | 4 |
| NDST1 | SCNN1B | 0.734604 | 8 | 0 | 8 |
| NDST1 | ARHGEF10L | 0.728908 | 10 | 0 | 9 |
| NDST1 | CASC3 | 0.724174 | 3 | 0 | 3 |
| NDST1 | SH3GLB1 | 0.722269 | 8 | 0 | 7 |
| NDST1 | CA13 | 0.719863 | 3 | 0 | 3 |
| NDST1 | EVPL | 0.718212 | 8 | 0 | 8 |
| NDST1 | KLHL2 | 0.714447 | 7 | 0 | 7 |
| NDST1 | MORN3 | 0.709966 | 3 | 0 | 3 |
| NDST1 | GRN | 0.709259 | 8 | 0 | 8 |
| NDST1 | TPCN1 | 0.708628 | 10 | 0 | 9 |
| NDST1 | PDLIM2 | 0.706371 | 8 | 0 | 6 |
For details and further investigation, click here