| Full name: death associated protein like 1 | Alias Symbol: | ||
| Type: protein-coding gene | Cytoband: 2q24.1 | ||
| Entrez ID: 92196 | HGNC ID: HGNC:21490 | Ensembl Gene: ENSG00000163331 | OMIM ID: |
Expression of DAPL1:
| Dataset | Gene | EntrezID | Probe | Log2FC | Adj.pValue | Expression |
|---|---|---|---|---|---|---|
| GSE17351 | DAPL1 | 92196 | 229290_at | -0.6729 | 0.3318 | |
| GSE26886 | DAPL1 | 92196 | 229290_at | -2.7405 | 0.0001 | |
| GSE45670 | DAPL1 | 92196 | 229290_at | -1.2884 | 0.0785 | |
| GSE53622 | DAPL1 | 92196 | 94722 | -1.7243 | 0.0000 | |
| GSE53624 | DAPL1 | 92196 | 94722 | -2.8857 | 0.0000 | |
| GSE63941 | DAPL1 | 92196 | 229290_at | 1.9584 | 0.2306 | |
| GSE77861 | DAPL1 | 92196 | 229290_at | -2.0708 | 0.1851 | |
| SRP007169 | DAPL1 | 92196 | RNAseq | -3.0968 | 0.0002 | |
| SRP008496 | DAPL1 | 92196 | RNAseq | -1.3773 | 0.1120 | |
| SRP064894 | DAPL1 | 92196 | RNAseq | -2.4745 | 0.0000 | |
| SRP133303 | DAPL1 | 92196 | RNAseq | -1.6367 | 0.0001 | |
| SRP159526 | DAPL1 | 92196 | RNAseq | -0.2918 | 0.7119 | |
| SRP219564 | DAPL1 | 92196 | RNAseq | -3.2252 | 0.0088 | |
| TCGA | DAPL1 | 92196 | RNAseq | 0.9002 | 0.0876 |
Upregulated datasets: 0; Downregulated datasets: 7.
Survival by DAPL1 expression:
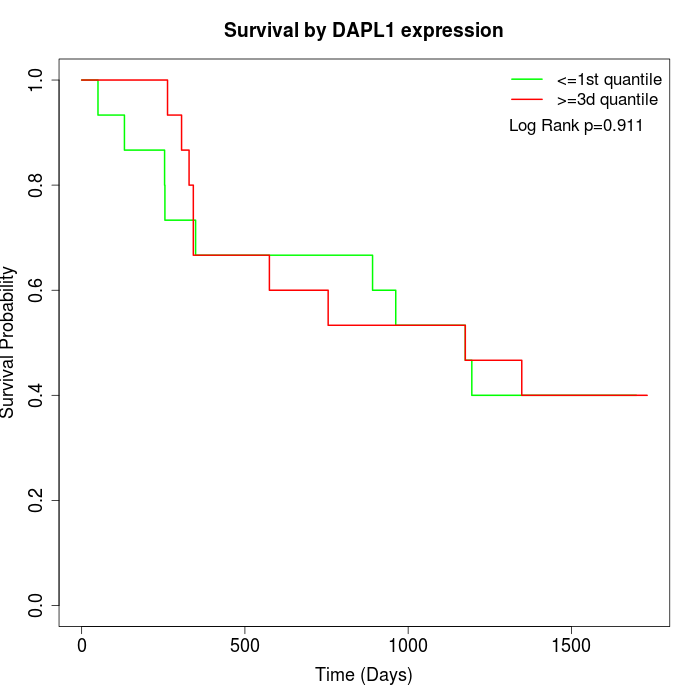 | 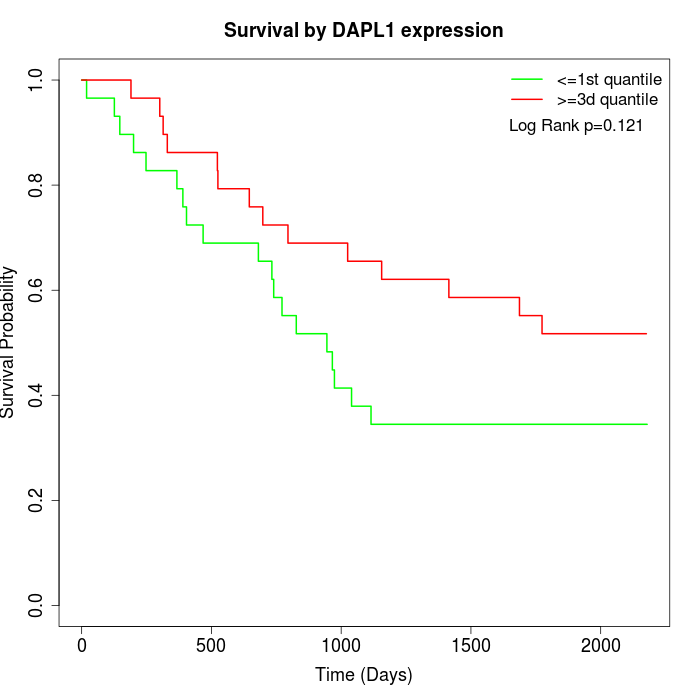 | 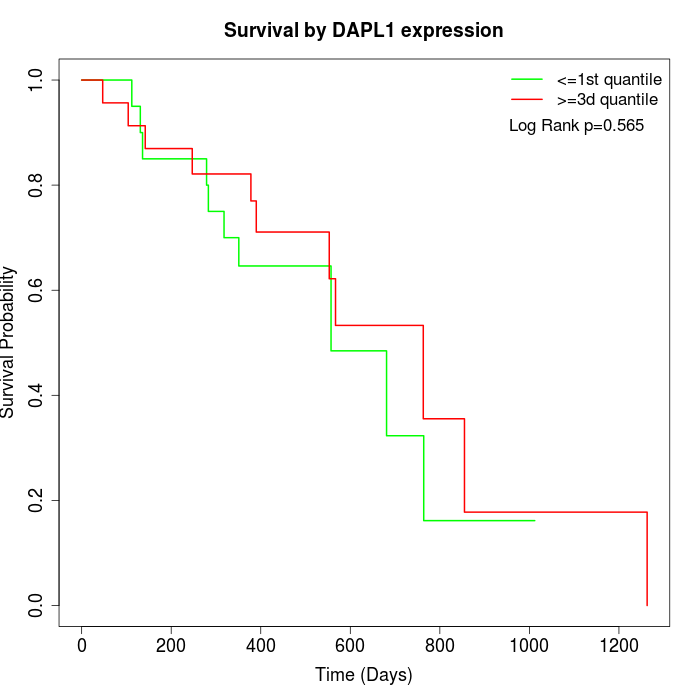 |
| GSE53622 | GSE53624 | TCGA |
Note: Click image to view full size file.
Copy number change of DAPL1:
| Dataset | Gene | EntrezID | Gain | Loss | Normal | Detail |
|---|---|---|---|---|---|---|
| GSE15526 | DAPL1 | 92196 | 5 | 1 | 24 | |
| GSE20123 | DAPL1 | 92196 | 5 | 1 | 24 | |
| GSE43470 | DAPL1 | 92196 | 4 | 1 | 38 | |
| GSE46452 | DAPL1 | 92196 | 1 | 4 | 54 | |
| GSE47630 | DAPL1 | 92196 | 5 | 3 | 32 | |
| GSE54993 | DAPL1 | 92196 | 0 | 4 | 66 | |
| GSE54994 | DAPL1 | 92196 | 11 | 2 | 40 | |
| GSE60625 | DAPL1 | 92196 | 0 | 3 | 8 | |
| GSE74703 | DAPL1 | 92196 | 3 | 1 | 32 | |
| GSE74704 | DAPL1 | 92196 | 3 | 0 | 17 | |
| TCGA | DAPL1 | 92196 | 23 | 10 | 63 |
Total number of gains: 60; Total number of losses: 30; Total Number of normals: 398.
Somatic mutations of DAPL1:
Generating mutation plots.
Highly correlated genes for DAPL1:
Showing top 20/785 corelated genes with mean PCC>0.5.
| Gene1 | Gene2 | Mean PCC | Num. Datasets | Num. PCC<0 | Num. PCC>0.5 |
|---|---|---|---|---|---|
| DAPL1 | RHBDF1 | 0.772646 | 3 | 0 | 3 |
| DAPL1 | KRT4 | 0.738741 | 5 | 0 | 5 |
| DAPL1 | TGM3 | 0.737667 | 6 | 0 | 6 |
| DAPL1 | SPINK7 | 0.732998 | 6 | 0 | 6 |
| DAPL1 | TMPRSS11B | 0.732921 | 6 | 0 | 6 |
| DAPL1 | A2ML1 | 0.73232 | 6 | 0 | 6 |
| DAPL1 | ZCCHC9 | 0.731885 | 3 | 0 | 3 |
| DAPL1 | METTL7A | 0.731635 | 4 | 0 | 4 |
| DAPL1 | CRABP2 | 0.731571 | 5 | 0 | 5 |
| DAPL1 | CRNN | 0.727179 | 6 | 0 | 6 |
| DAPL1 | RHCG | 0.724953 | 6 | 0 | 5 |
| DAPL1 | PITX1 | 0.723535 | 5 | 0 | 5 |
| DAPL1 | VSIG10L | 0.721146 | 6 | 0 | 6 |
| DAPL1 | ZNF185 | 0.721112 | 6 | 0 | 6 |
| DAPL1 | HOPX | 0.718705 | 6 | 0 | 6 |
| DAPL1 | FAM3B | 0.717122 | 5 | 0 | 5 |
| DAPL1 | CAPNS2 | 0.716517 | 4 | 0 | 4 |
| DAPL1 | MPC1 | 0.715338 | 4 | 0 | 4 |
| DAPL1 | PPL | 0.710083 | 6 | 0 | 6 |
| DAPL1 | SCEL | 0.707797 | 6 | 0 | 5 |
For details and further investigation, click here