| Full name: calpain small subunit 2 | Alias Symbol: MGC12536|MGC14804 | ||
| Type: protein-coding gene | Cytoband: 16q12.2 | ||
| Entrez ID: 84290 | HGNC ID: HGNC:16371 | Ensembl Gene: ENSG00000256812 | OMIM ID: 616767 |
Expression of CAPNS2:
| Dataset | Gene | EntrezID | Probe | Log2FC | Adj.pValue | Expression |
|---|---|---|---|---|---|---|
| GSE17351 | CAPNS2 | 84290 | 223832_s_at | -1.5212 | 0.0241 | |
| GSE26886 | CAPNS2 | 84290 | 223832_s_at | -3.4113 | 0.0000 | |
| GSE45670 | CAPNS2 | 84290 | 223832_s_at | -0.7250 | 0.0687 | |
| GSE63941 | CAPNS2 | 84290 | 223832_s_at | 1.5298 | 0.2449 | |
| GSE77861 | CAPNS2 | 84290 | 223832_s_at | -1.3112 | 0.1579 | |
| GSE97050 | CAPNS2 | 84290 | A_23_P152406 | -0.1992 | 0.6121 | |
| SRP007169 | CAPNS2 | 84290 | RNAseq | -3.3570 | 0.0000 | |
| SRP008496 | CAPNS2 | 84290 | RNAseq | -3.4437 | 0.0000 | |
| SRP064894 | CAPNS2 | 84290 | RNAseq | -2.7920 | 0.0000 | |
| SRP133303 | CAPNS2 | 84290 | RNAseq | -1.3700 | 0.0007 | |
| SRP159526 | CAPNS2 | 84290 | RNAseq | -1.8780 | 0.0466 | |
| SRP219564 | CAPNS2 | 84290 | RNAseq | -1.8016 | 0.1405 | |
| TCGA | CAPNS2 | 84290 | RNAseq | 1.6665 | 0.0000 |
Upregulated datasets: 1; Downregulated datasets: 7.
Survival by CAPNS2 expression:
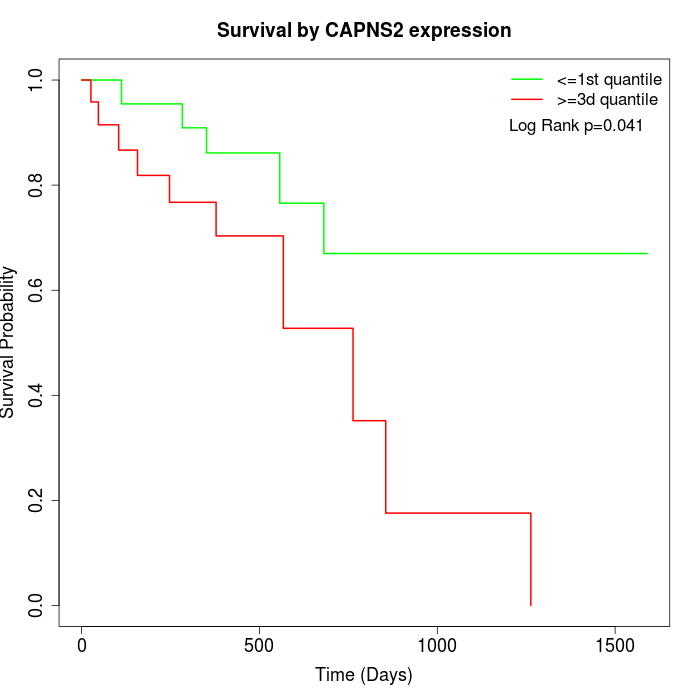 |
| TCGA |
Note: Click image to view full size file.
Copy number change of CAPNS2:
| Dataset | Gene | EntrezID | Gain | Loss | Normal | Detail |
|---|---|---|---|---|---|---|
| GSE15526 | CAPNS2 | 84290 | 4 | 0 | 26 | |
| GSE20123 | CAPNS2 | 84290 | 4 | 0 | 26 | |
| GSE43470 | CAPNS2 | 84290 | 2 | 7 | 34 | |
| GSE46452 | CAPNS2 | 84290 | 38 | 1 | 20 | |
| GSE47630 | CAPNS2 | 84290 | 10 | 8 | 22 | |
| GSE54993 | CAPNS2 | 84290 | 2 | 4 | 64 | |
| GSE54994 | CAPNS2 | 84290 | 7 | 10 | 36 | |
| GSE60625 | CAPNS2 | 84290 | 4 | 0 | 7 | |
| GSE74703 | CAPNS2 | 84290 | 2 | 4 | 30 | |
| GSE74704 | CAPNS2 | 84290 | 3 | 0 | 17 | |
| TCGA | CAPNS2 | 84290 | 25 | 12 | 59 |
Total number of gains: 101; Total number of losses: 46; Total Number of normals: 341.
Somatic mutations of CAPNS2:
Generating mutation plots.
Highly correlated genes for CAPNS2:
Showing top 20/1224 corelated genes with mean PCC>0.5.
| Gene1 | Gene2 | Mean PCC | Num. Datasets | Num. PCC<0 | Num. PCC>0.5 |
|---|---|---|---|---|---|
| CAPNS2 | SASH1 | 0.826566 | 5 | 0 | 5 |
| CAPNS2 | MAL | 0.811006 | 4 | 0 | 4 |
| CAPNS2 | PLD1 | 0.809965 | 5 | 0 | 5 |
| CAPNS2 | RNF141 | 0.808265 | 5 | 0 | 5 |
| CAPNS2 | CRNN | 0.799862 | 4 | 0 | 4 |
| CAPNS2 | IKZF2 | 0.799322 | 5 | 0 | 5 |
| CAPNS2 | KLF8 | 0.797259 | 5 | 0 | 5 |
| CAPNS2 | GBP6 | 0.79699 | 4 | 0 | 4 |
| CAPNS2 | DHRS9 | 0.794973 | 3 | 0 | 3 |
| CAPNS2 | SERPINB1 | 0.786555 | 5 | 0 | 5 |
| CAPNS2 | PRSS27 | 0.785948 | 4 | 0 | 4 |
| CAPNS2 | RASSF5 | 0.785097 | 5 | 0 | 5 |
| CAPNS2 | TSPAN6 | 0.78362 | 5 | 0 | 5 |
| CAPNS2 | SPINK7 | 0.78163 | 4 | 0 | 4 |
| CAPNS2 | TIAM1 | 0.779036 | 5 | 0 | 5 |
| CAPNS2 | CAPN14 | 0.778163 | 4 | 0 | 4 |
| CAPNS2 | DIAPH1 | 0.776877 | 3 | 0 | 3 |
| CAPNS2 | SCEL | 0.776857 | 4 | 0 | 4 |
| CAPNS2 | PLIN3 | 0.776223 | 4 | 0 | 4 |
| CAPNS2 | CYP3A5 | 0.775884 | 4 | 0 | 4 |
For details and further investigation, click here