| Full name: essential meiotic structure-specific endonuclease subunit 2 | Alias Symbol: FLJ00151|SLX2B | ||
| Type: protein-coding gene | Cytoband: 16p13.3 | ||
| Entrez ID: 197342 | HGNC ID: HGNC:27289 | Ensembl Gene: ENSG00000197774 | OMIM ID: 610886 |
Expression of EME2:
| Dataset | Gene | EntrezID | Probe | Log2FC | Adj.pValue | Expression |
|---|---|---|---|---|---|---|
| GSE17351 | EME2 | 197342 | 1569868_s_at | -0.1359 | 0.7899 | |
| GSE26886 | EME2 | 197342 | 1569868_s_at | -0.4517 | 0.0598 | |
| GSE45670 | EME2 | 197342 | 1569868_s_at | 0.0130 | 0.9656 | |
| GSE53622 | EME2 | 197342 | 83580 | 0.2835 | 0.0004 | |
| GSE53624 | EME2 | 197342 | 83580 | 0.2373 | 0.0016 | |
| GSE63941 | EME2 | 197342 | 1569868_s_at | -0.1352 | 0.6967 | |
| GSE77861 | EME2 | 197342 | 1569868_s_at | 0.1155 | 0.6647 | |
| GSE97050 | EME2 | 197342 | A_33_P3297005 | 0.2370 | 0.3820 | |
| SRP133303 | EME2 | 197342 | RNAseq | -0.1953 | 0.4913 | |
| SRP159526 | EME2 | 197342 | RNAseq | -0.7273 | 0.0544 | |
| SRP193095 | EME2 | 197342 | RNAseq | 0.2592 | 0.1342 | |
| SRP219564 | EME2 | 197342 | RNAseq | -0.8923 | 0.1455 | |
| TCGA | EME2 | 197342 | RNAseq | 0.0811 | 0.5598 |
Upregulated datasets: 0; Downregulated datasets: 0.
Survival by EME2 expression:
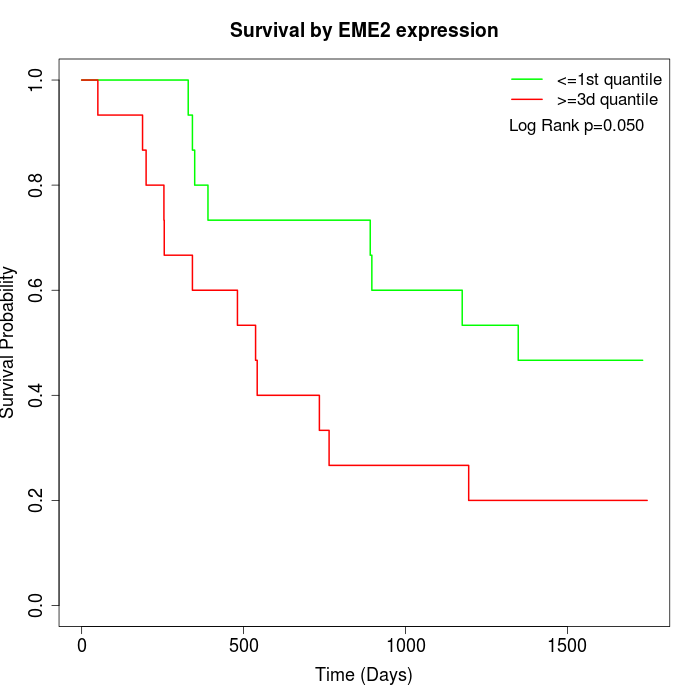 | 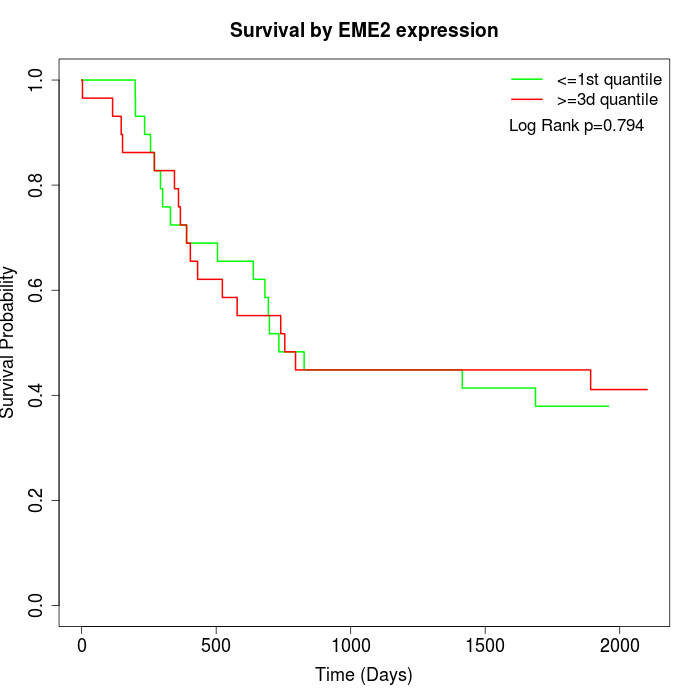 | 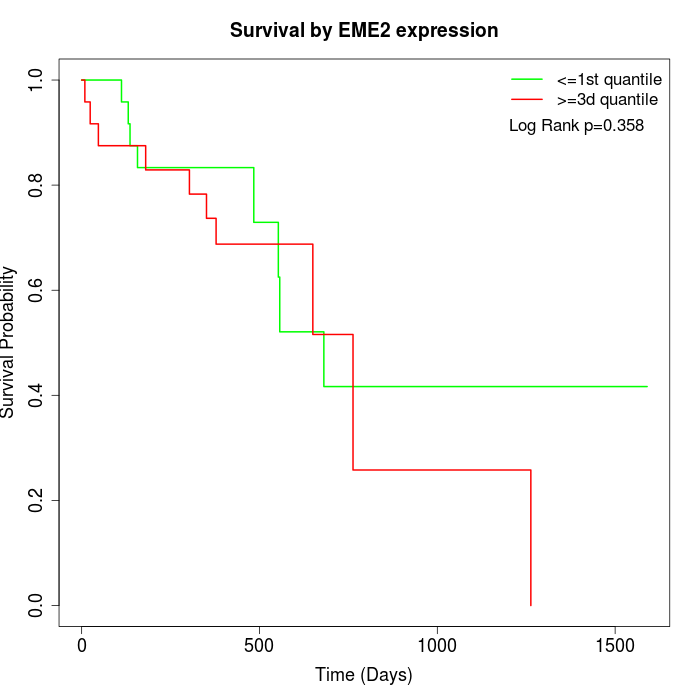 |
| GSE53622 | GSE53624 | TCGA |
Note: Click image to view full size file.
Copy number change of EME2:
| Dataset | Gene | EntrezID | Gain | Loss | Normal | Detail |
|---|---|---|---|---|---|---|
| GSE15526 | EME2 | 197342 | 5 | 5 | 20 | |
| GSE20123 | EME2 | 197342 | 5 | 4 | 21 | |
| GSE43470 | EME2 | 197342 | 4 | 7 | 32 | |
| GSE46452 | EME2 | 197342 | 38 | 1 | 20 | |
| GSE47630 | EME2 | 197342 | 13 | 6 | 21 | |
| GSE54993 | EME2 | 197342 | 3 | 5 | 62 | |
| GSE54994 | EME2 | 197342 | 6 | 8 | 39 | |
| GSE60625 | EME2 | 197342 | 4 | 0 | 7 | |
| GSE74703 | EME2 | 197342 | 4 | 5 | 27 | |
| GSE74704 | EME2 | 197342 | 3 | 2 | 15 | |
| TCGA | EME2 | 197342 | 19 | 14 | 63 |
Total number of gains: 104; Total number of losses: 57; Total Number of normals: 327.
Somatic mutations of EME2:
Generating mutation plots.
Highly correlated genes for EME2:
Showing top 20/42 corelated genes with mean PCC>0.5.
| Gene1 | Gene2 | Mean PCC | Num. Datasets | Num. PCC<0 | Num. PCC>0.5 |
|---|---|---|---|---|---|
| EME2 | SNED1 | 0.721783 | 3 | 0 | 3 |
| EME2 | DNAH6 | 0.717879 | 3 | 0 | 3 |
| EME2 | GPR52 | 0.717753 | 3 | 0 | 3 |
| EME2 | MS4A18 | 0.708665 | 3 | 0 | 3 |
| EME2 | PPP1R14D | 0.703026 | 3 | 0 | 3 |
| EME2 | PLA2G4F | 0.691383 | 3 | 0 | 3 |
| EME2 | OPN4 | 0.69095 | 3 | 0 | 3 |
| EME2 | LAMA5 | 0.683213 | 3 | 0 | 3 |
| EME2 | LHB | 0.674662 | 3 | 0 | 3 |
| EME2 | KCNC3 | 0.668236 | 4 | 0 | 3 |
| EME2 | OR2A5 | 0.659348 | 3 | 0 | 3 |
| EME2 | MAST4 | 0.65732 | 3 | 0 | 3 |
| EME2 | RPA4 | 0.635833 | 3 | 0 | 3 |
| EME2 | POLM | 0.624277 | 4 | 0 | 4 |
| EME2 | SLC22A14 | 0.610011 | 4 | 0 | 3 |
| EME2 | RALGDS | 0.603178 | 3 | 0 | 3 |
| EME2 | PNPLA7 | 0.601509 | 3 | 0 | 3 |
| EME2 | BEAN1 | 0.600831 | 4 | 0 | 3 |
| EME2 | TBL3 | 0.593277 | 4 | 0 | 3 |
| EME2 | PLEKHH3 | 0.593179 | 4 | 0 | 3 |
For details and further investigation, click here