| Full name: epidermal growth factor receptor pathway substrate 15 | Alias Symbol: AF-1P|MLLT5 | ||
| Type: protein-coding gene | Cytoband: 1p32.3 | ||
| Entrez ID: 2060 | HGNC ID: HGNC:3419 | Ensembl Gene: ENSG00000085832 | OMIM ID: 600051 |
Expression of EPS15:
| Dataset | Gene | EntrezID | Probe | Log2FC | Adj.pValue | Expression |
|---|---|---|---|---|---|---|
| GSE17351 | EPS15 | 2060 | 217887_s_at | -0.2660 | 0.4065 | |
| GSE20347 | EPS15 | 2060 | 217887_s_at | -0.6328 | 0.0007 | |
| GSE23400 | EPS15 | 2060 | 217887_s_at | -0.2663 | 0.0003 | |
| GSE26886 | EPS15 | 2060 | 217886_at | -1.1680 | 0.0000 | |
| GSE29001 | EPS15 | 2060 | 217886_at | -0.0999 | 0.7405 | |
| GSE38129 | EPS15 | 2060 | 217887_s_at | -0.5674 | 0.0000 | |
| GSE45670 | EPS15 | 2060 | 217887_s_at | -0.5635 | 0.0001 | |
| GSE53622 | EPS15 | 2060 | 54007 | -0.5667 | 0.0000 | |
| GSE53624 | EPS15 | 2060 | 54007 | -0.5740 | 0.0000 | |
| GSE63941 | EPS15 | 2060 | 217887_s_at | -0.7294 | 0.0890 | |
| GSE77861 | EPS15 | 2060 | 217887_s_at | -0.7933 | 0.0087 | |
| GSE97050 | EPS15 | 2060 | A_33_P3371752 | 0.0243 | 0.9268 | |
| SRP007169 | EPS15 | 2060 | RNAseq | -1.2052 | 0.0000 | |
| SRP008496 | EPS15 | 2060 | RNAseq | -1.1063 | 0.0000 | |
| SRP064894 | EPS15 | 2060 | RNAseq | -0.3041 | 0.0764 | |
| SRP133303 | EPS15 | 2060 | RNAseq | -0.2378 | 0.1089 | |
| SRP159526 | EPS15 | 2060 | RNAseq | -0.7634 | 0.0000 | |
| SRP193095 | EPS15 | 2060 | RNAseq | -0.5951 | 0.0000 | |
| SRP219564 | EPS15 | 2060 | RNAseq | -0.1297 | 0.5712 | |
| TCGA | EPS15 | 2060 | RNAseq | -0.1535 | 0.0004 |
Upregulated datasets: 0; Downregulated datasets: 3.
Survival by EPS15 expression:
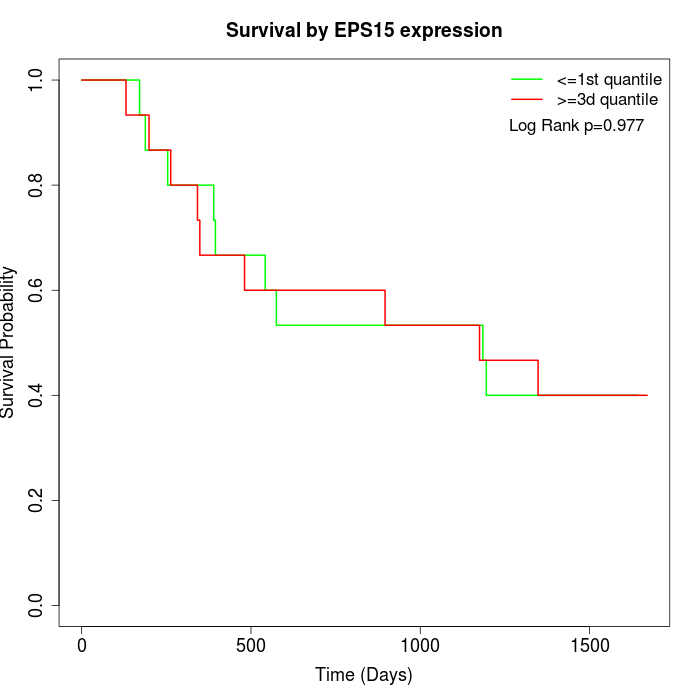 | 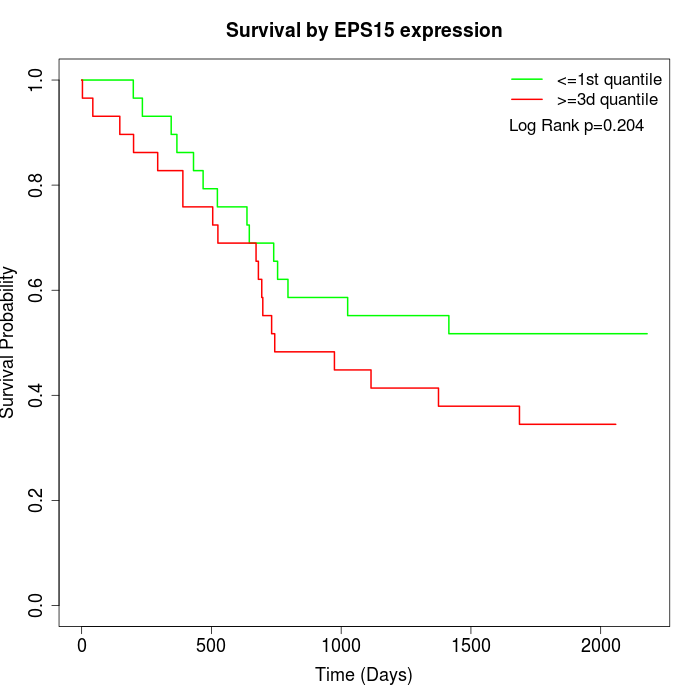 | 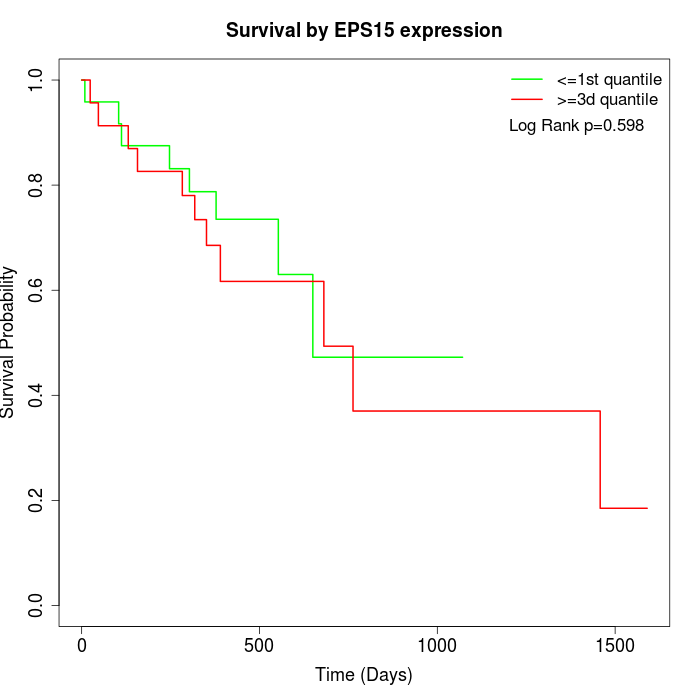 |
| GSE53622 | GSE53624 | TCGA |
Note: Click image to view full size file.
Copy number change of EPS15:
| Dataset | Gene | EntrezID | Gain | Loss | Normal | Detail |
|---|---|---|---|---|---|---|
| GSE15526 | EPS15 | 2060 | 3 | 4 | 23 | |
| GSE20123 | EPS15 | 2060 | 3 | 3 | 24 | |
| GSE43470 | EPS15 | 2060 | 5 | 4 | 34 | |
| GSE46452 | EPS15 | 2060 | 2 | 1 | 56 | |
| GSE47630 | EPS15 | 2060 | 8 | 4 | 28 | |
| GSE54993 | EPS15 | 2060 | 0 | 1 | 69 | |
| GSE54994 | EPS15 | 2060 | 11 | 2 | 40 | |
| GSE60625 | EPS15 | 2060 | 0 | 0 | 11 | |
| GSE74703 | EPS15 | 2060 | 4 | 2 | 30 | |
| GSE74704 | EPS15 | 2060 | 2 | 0 | 18 | |
| TCGA | EPS15 | 2060 | 10 | 18 | 68 |
Total number of gains: 48; Total number of losses: 39; Total Number of normals: 401.
Somatic mutations of EPS15:
Generating mutation plots.
Highly correlated genes for EPS15:
Showing top 20/1268 corelated genes with mean PCC>0.5.
| Gene1 | Gene2 | Mean PCC | Num. Datasets | Num. PCC<0 | Num. PCC>0.5 |
|---|---|---|---|---|---|
| EPS15 | MBNL3 | 0.774883 | 5 | 0 | 4 |
| EPS15 | PPFIBP2 | 0.767119 | 4 | 0 | 4 |
| EPS15 | SLC11A2 | 0.765193 | 3 | 0 | 3 |
| EPS15 | BRWD3 | 0.762012 | 3 | 0 | 3 |
| EPS15 | RNF183 | 0.760198 | 3 | 0 | 3 |
| EPS15 | SOX21-AS1 | 0.746377 | 3 | 0 | 3 |
| EPS15 | EPB41 | 0.744543 | 5 | 0 | 5 |
| EPS15 | PARG | 0.736469 | 3 | 0 | 3 |
| EPS15 | BRK1 | 0.734604 | 6 | 0 | 6 |
| EPS15 | NANS | 0.730577 | 4 | 0 | 3 |
| EPS15 | SH2D4A | 0.727009 | 4 | 0 | 3 |
| EPS15 | NHSL1 | 0.726363 | 3 | 0 | 3 |
| EPS15 | RPL14 | 0.726237 | 3 | 0 | 3 |
| EPS15 | ZNF675 | 0.725995 | 4 | 0 | 4 |
| EPS15 | SLC44A3 | 0.724893 | 6 | 0 | 5 |
| EPS15 | SNORA68 | 0.721902 | 4 | 0 | 4 |
| EPS15 | ZNF436 | 0.713067 | 6 | 0 | 5 |
| EPS15 | RNASEL | 0.712729 | 3 | 0 | 3 |
| EPS15 | ZNF823 | 0.709672 | 6 | 0 | 4 |
| EPS15 | SYTL5 | 0.708497 | 3 | 0 | 3 |
For details and further investigation, click here