| Full name: endothelial cell specific molecule 1 | Alias Symbol: | ||
| Type: protein-coding gene | Cytoband: 5q11.2 | ||
| Entrez ID: 11082 | HGNC ID: HGNC:3466 | Ensembl Gene: ENSG00000164283 | OMIM ID: 601521 |
Expression of ESM1:
| Dataset | Gene | EntrezID | Probe | Log2FC | Adj.pValue | Expression |
|---|---|---|---|---|---|---|
| GSE17351 | ESM1 | 11082 | 208394_x_at | 1.5473 | 0.0425 | |
| GSE20347 | ESM1 | 11082 | 208394_x_at | 0.4464 | 0.0003 | |
| GSE23400 | ESM1 | 11082 | 208394_x_at | 0.1459 | 0.0000 | |
| GSE26886 | ESM1 | 11082 | 208394_x_at | 0.0053 | 0.9731 | |
| GSE29001 | ESM1 | 11082 | 208394_x_at | 0.3924 | 0.0623 | |
| GSE38129 | ESM1 | 11082 | 208394_x_at | 0.5836 | 0.0000 | |
| GSE45670 | ESM1 | 11082 | 208394_x_at | 1.1070 | 0.0042 | |
| GSE53622 | ESM1 | 11082 | 21957 | 3.7447 | 0.0000 | |
| GSE53624 | ESM1 | 11082 | 21957 | 3.6586 | 0.0000 | |
| GSE63941 | ESM1 | 11082 | 208394_x_at | -0.3990 | 0.3853 | |
| GSE77861 | ESM1 | 11082 | 208394_x_at | 0.1421 | 0.3174 | |
| GSE97050 | ESM1 | 11082 | A_23_P144843 | 0.4418 | 0.1817 | |
| SRP064894 | ESM1 | 11082 | RNAseq | 4.2762 | 0.0000 | |
| SRP133303 | ESM1 | 11082 | RNAseq | 4.1770 | 0.0000 | |
| SRP159526 | ESM1 | 11082 | RNAseq | 3.1164 | 0.0000 | |
| SRP219564 | ESM1 | 11082 | RNAseq | 3.3199 | 0.0000 | |
| TCGA | ESM1 | 11082 | RNAseq | 2.0361 | 0.0000 |
Upregulated datasets: 9; Downregulated datasets: 0.
Survival by ESM1 expression:
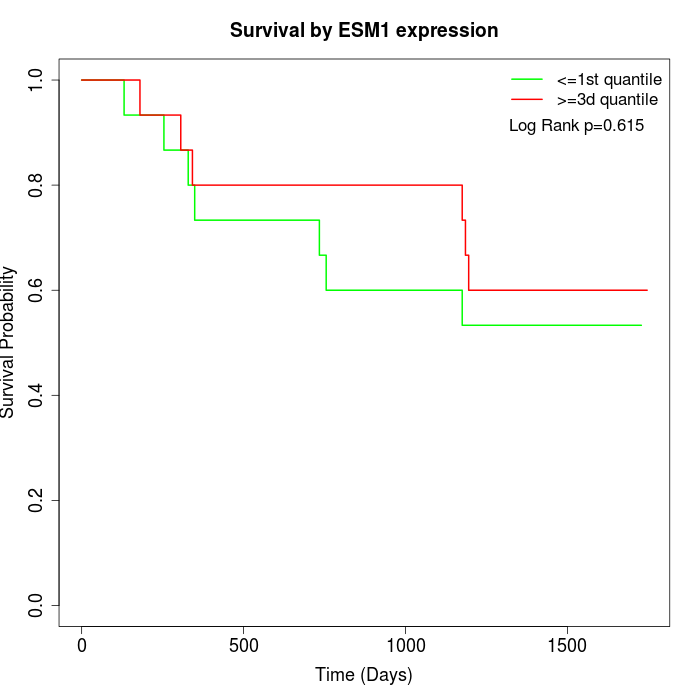 | 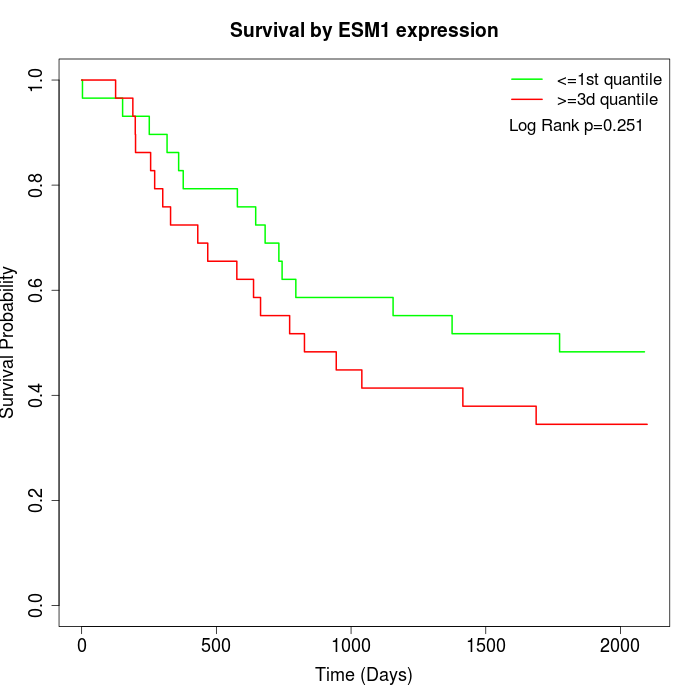 | 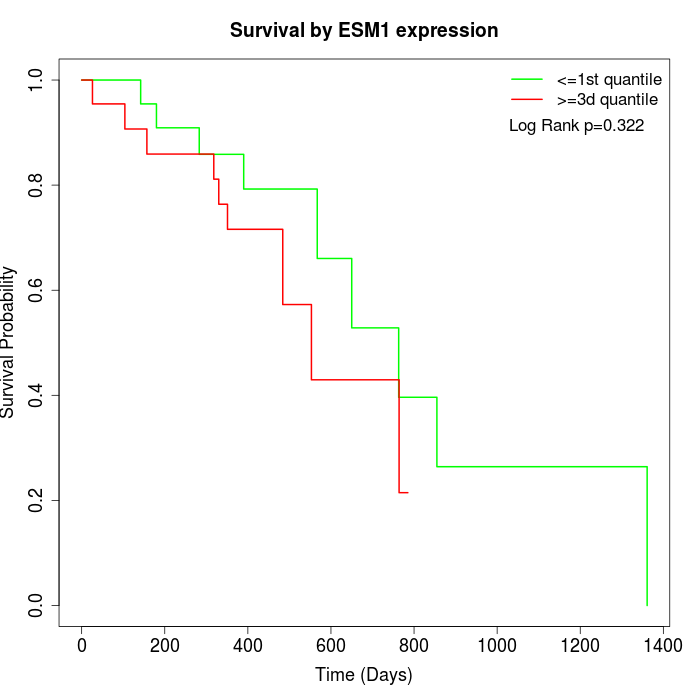 |
| GSE53622 | GSE53624 | TCGA |
Note: Click image to view full size file.
Copy number change of ESM1:
| Dataset | Gene | EntrezID | Gain | Loss | Normal | Detail |
|---|---|---|---|---|---|---|
| GSE15526 | ESM1 | 11082 | 1 | 13 | 16 | |
| GSE20123 | ESM1 | 11082 | 1 | 13 | 16 | |
| GSE43470 | ESM1 | 11082 | 1 | 12 | 30 | |
| GSE46452 | ESM1 | 11082 | 1 | 27 | 31 | |
| GSE47630 | ESM1 | 11082 | 2 | 16 | 22 | |
| GSE54993 | ESM1 | 11082 | 8 | 1 | 61 | |
| GSE54994 | ESM1 | 11082 | 4 | 19 | 30 | |
| GSE60625 | ESM1 | 11082 | 0 | 0 | 11 | |
| GSE74703 | ESM1 | 11082 | 1 | 9 | 26 | |
| GSE74704 | ESM1 | 11082 | 1 | 6 | 13 | |
| TCGA | ESM1 | 11082 | 8 | 45 | 43 |
Total number of gains: 28; Total number of losses: 161; Total Number of normals: 299.
Somatic mutations of ESM1:
Generating mutation plots.
Highly correlated genes for ESM1:
Showing top 20/1343 corelated genes with mean PCC>0.5.
| Gene1 | Gene2 | Mean PCC | Num. Datasets | Num. PCC<0 | Num. PCC>0.5 |
|---|---|---|---|---|---|
| ESM1 | SLC39A10 | 0.795671 | 4 | 0 | 4 |
| ESM1 | SLC7A6OS | 0.792981 | 3 | 0 | 3 |
| ESM1 | FAM89A | 0.782715 | 3 | 0 | 3 |
| ESM1 | ALPK2 | 0.782329 | 3 | 0 | 3 |
| ESM1 | G2E3 | 0.756256 | 5 | 0 | 5 |
| ESM1 | UCK2 | 0.750334 | 3 | 0 | 3 |
| ESM1 | ZNF707 | 0.74413 | 3 | 0 | 3 |
| ESM1 | ADAMTS12 | 0.741915 | 7 | 0 | 7 |
| ESM1 | SPON2 | 0.739344 | 3 | 0 | 3 |
| ESM1 | ANLN | 0.731994 | 5 | 0 | 5 |
| ESM1 | CDCA2 | 0.723236 | 3 | 0 | 3 |
| ESM1 | SLC35B2 | 0.716242 | 3 | 0 | 3 |
| ESM1 | EME1 | 0.716171 | 3 | 0 | 3 |
| ESM1 | WDR54 | 0.715497 | 6 | 0 | 6 |
| ESM1 | TSHR | 0.713651 | 3 | 0 | 3 |
| ESM1 | MMS22L | 0.712549 | 3 | 0 | 3 |
| ESM1 | GNG10 | 0.710351 | 3 | 0 | 3 |
| ESM1 | NUDCD1 | 0.699023 | 5 | 0 | 5 |
| ESM1 | BMP2 | 0.698074 | 3 | 0 | 3 |
| ESM1 | CPT1C | 0.694534 | 4 | 0 | 4 |
For details and further investigation, click here