| Full name: coagulation factor X | Alias Symbol: | ||
| Type: protein-coding gene | Cytoband: 13q34 | ||
| Entrez ID: 2159 | HGNC ID: HGNC:3528 | Ensembl Gene: ENSG00000126218 | OMIM ID: 613872 |
| Related drugs: ANTIHEMOPHILIC FACTOR, APIXABAN, BETRIXABAN, CHEMBL1271162, CHOLESTEROL, DANAPAROID SODIUM, EDOXABAN, EDOXABAN TOSYLATE, EMICIZUMAB, ENOXAPARIN... [more] | |||
F10 involved pathways:
| KEGG pathway | Description | View |
|---|---|---|
| hsa04610 | Complement and coagulation cascades |
Expression of F10:
| Dataset | Gene | EntrezID | Probe | Log2FC | Adj.pValue | Expression |
|---|---|---|---|---|---|---|
| GSE17351 | F10 | 2159 | 205620_at | -0.6408 | 0.0337 | |
| GSE20347 | F10 | 2159 | 205620_at | -0.3124 | 0.0002 | |
| GSE23400 | F10 | 2159 | 205620_at | -0.4399 | 0.0000 | |
| GSE26886 | F10 | 2159 | 205620_at | 0.0527 | 0.7201 | |
| GSE29001 | F10 | 2159 | 205620_at | -0.4109 | 0.0014 | |
| GSE38129 | F10 | 2159 | 205620_at | -0.5684 | 0.0000 | |
| GSE45670 | F10 | 2159 | 205620_at | -1.1725 | 0.0000 | |
| GSE53622 | F10 | 2159 | 72702 | -2.0143 | 0.0000 | |
| GSE53624 | F10 | 2159 | 72702 | -2.3813 | 0.0000 | |
| GSE63941 | F10 | 2159 | 205620_at | -1.2930 | 0.0000 | |
| GSE77861 | F10 | 2159 | 205620_at | -0.1057 | 0.3763 | |
| GSE97050 | F10 | 2159 | A_23_P205177 | -0.8178 | 0.2334 | |
| SRP064894 | F10 | 2159 | RNAseq | -1.7894 | 0.0013 | |
| SRP133303 | F10 | 2159 | RNAseq | -2.0603 | 0.0000 | |
| SRP159526 | F10 | 2159 | RNAseq | -2.1799 | 0.0000 | |
| SRP219564 | F10 | 2159 | RNAseq | -0.2244 | 0.7754 | |
| TCGA | F10 | 2159 | RNAseq | -1.9022 | 0.0000 |
Upregulated datasets: 0; Downregulated datasets: 8.
Survival by F10 expression:
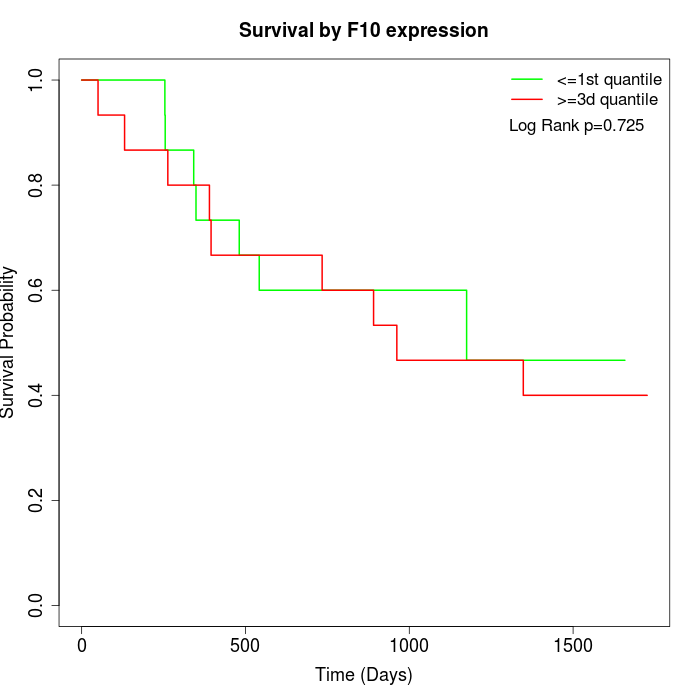 | 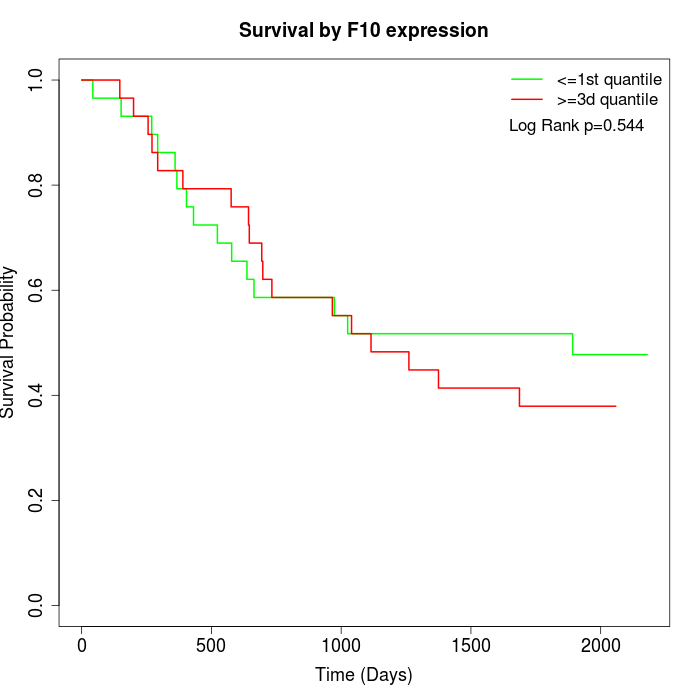 | 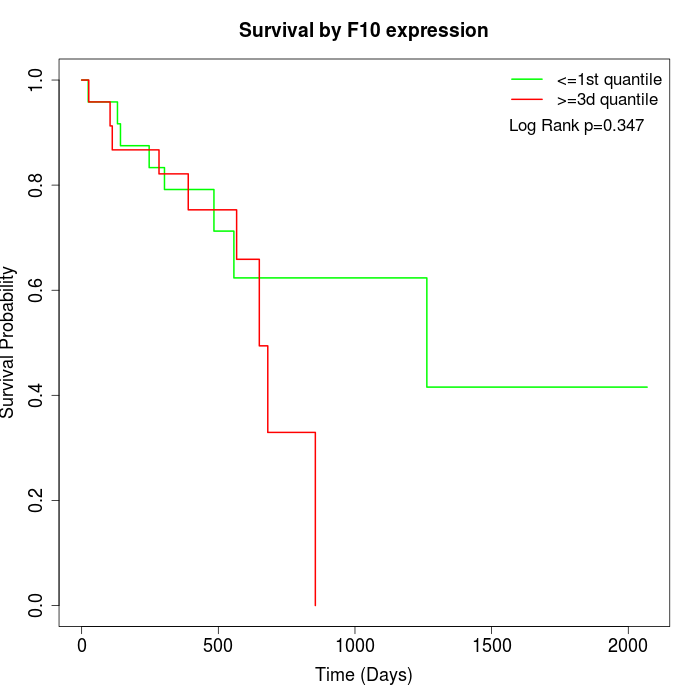 |
| GSE53622 | GSE53624 | TCGA |
Note: Click image to view full size file.
Copy number change of F10:
| Dataset | Gene | EntrezID | Gain | Loss | Normal | Detail |
|---|---|---|---|---|---|---|
| GSE15526 | F10 | 2159 | 7 | 12 | 11 | |
| GSE20123 | F10 | 2159 | 7 | 11 | 12 | |
| GSE43470 | F10 | 2159 | 4 | 15 | 24 | |
| GSE46452 | F10 | 2159 | 3 | 31 | 25 | |
| GSE47630 | F10 | 2159 | 3 | 26 | 11 | |
| GSE54993 | F10 | 2159 | 11 | 4 | 55 | |
| GSE54994 | F10 | 2159 | 10 | 9 | 34 | |
| GSE60625 | F10 | 2159 | 0 | 3 | 8 | |
| GSE74703 | F10 | 2159 | 3 | 11 | 22 | |
| GSE74704 | F10 | 2159 | 4 | 9 | 7 | |
| TCGA | F10 | 2159 | 20 | 31 | 45 |
Total number of gains: 72; Total number of losses: 162; Total Number of normals: 254.
Somatic mutations of F10:
Generating mutation plots.
Highly correlated genes for F10:
Showing top 20/1226 corelated genes with mean PCC>0.5.
| Gene1 | Gene2 | Mean PCC | Num. Datasets | Num. PCC<0 | Num. PCC>0.5 |
|---|---|---|---|---|---|
| F10 | CYP21A2 | 0.883564 | 3 | 0 | 3 |
| F10 | CLEC3B | 0.876247 | 3 | 0 | 3 |
| F10 | PGM5-AS1 | 0.874328 | 3 | 0 | 3 |
| F10 | NEGR1 | 0.839151 | 6 | 0 | 6 |
| F10 | GFRA1 | 0.820242 | 6 | 0 | 6 |
| F10 | CCL14 | 0.800041 | 3 | 0 | 3 |
| F10 | C1QTNF7 | 0.78232 | 6 | 0 | 5 |
| F10 | ZNF582 | 0.780006 | 4 | 0 | 4 |
| F10 | MYRIP | 0.775985 | 9 | 0 | 9 |
| F10 | CFD | 0.773852 | 10 | 0 | 9 |
| F10 | RSPO2 | 0.773674 | 3 | 0 | 3 |
| F10 | MYOC | 0.770823 | 8 | 0 | 8 |
| F10 | MAMDC2 | 0.769915 | 6 | 0 | 5 |
| F10 | LINC01279 | 0.765603 | 3 | 0 | 3 |
| F10 | MAGI2-AS3 | 0.765507 | 5 | 0 | 5 |
| F10 | PLAC9 | 0.765002 | 7 | 0 | 7 |
| F10 | RBFOX3 | 0.758038 | 3 | 0 | 3 |
| F10 | ADH1B | 0.757369 | 10 | 0 | 10 |
| F10 | DPT | 0.753517 | 11 | 0 | 11 |
| F10 | LRRK2 | 0.750545 | 6 | 0 | 6 |
For details and further investigation, click here