| Full name: placenta associated 9 | Alias Symbol: | ||
| Type: protein-coding gene | Cytoband: 10q22.3 | ||
| Entrez ID: 219348 | HGNC ID: HGNC:19255 | Ensembl Gene: ENSG00000189129 | OMIM ID: 612857 |
Screen Evidence:
| |||
Expression of PLAC9:
| Dataset | Gene | EntrezID | Probe | Log2FC | Adj.pValue | Expression |
|---|---|---|---|---|---|---|
| GSE17351 | PLAC9 | 219348 | 227419_x_at | -1.8216 | 0.0608 | |
| GSE26886 | PLAC9 | 219348 | 230246_at | -0.1589 | 0.1802 | |
| GSE45670 | PLAC9 | 219348 | 230246_at | -0.4658 | 0.0003 | |
| GSE53622 | PLAC9 | 219348 | 32104 | -1.9645 | 0.0000 | |
| GSE53624 | PLAC9 | 219348 | 32104 | -2.0027 | 0.0000 | |
| GSE63941 | PLAC9 | 219348 | 230246_at | -0.1106 | 0.4618 | |
| GSE77861 | PLAC9 | 219348 | 230246_at | -0.2205 | 0.1708 | |
| GSE97050 | PLAC9 | 219348 | A_33_P3252785 | -0.9362 | 0.1453 | |
| SRP064894 | PLAC9 | 219348 | RNAseq | -1.4417 | 0.0182 | |
| SRP133303 | PLAC9 | 219348 | RNAseq | -1.8977 | 0.0000 | |
| SRP159526 | PLAC9 | 219348 | RNAseq | -2.0862 | 0.0000 | |
| SRP219564 | PLAC9 | 219348 | RNAseq | -0.2104 | 0.8349 | |
| TCGA | PLAC9 | 219348 | RNAseq | -1.5265 | 0.0000 |
Upregulated datasets: 0; Downregulated datasets: 6.
Survival by PLAC9 expression:
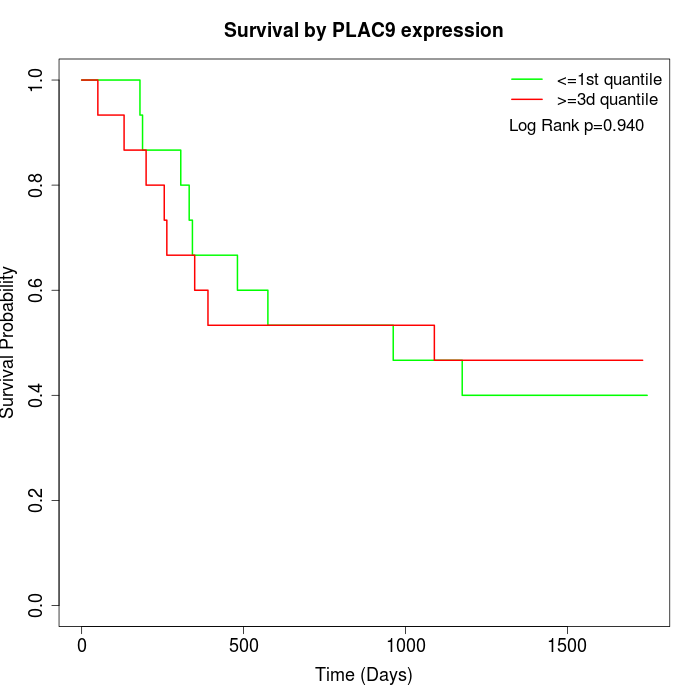 | 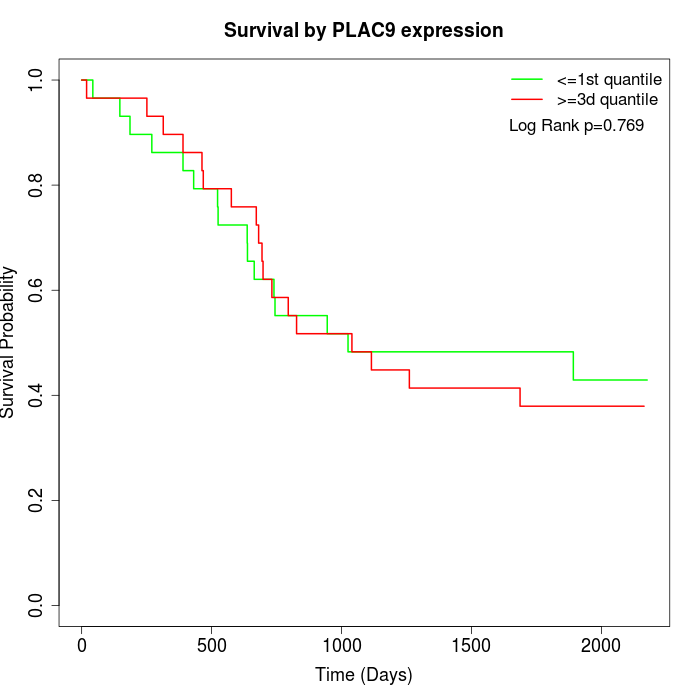 | 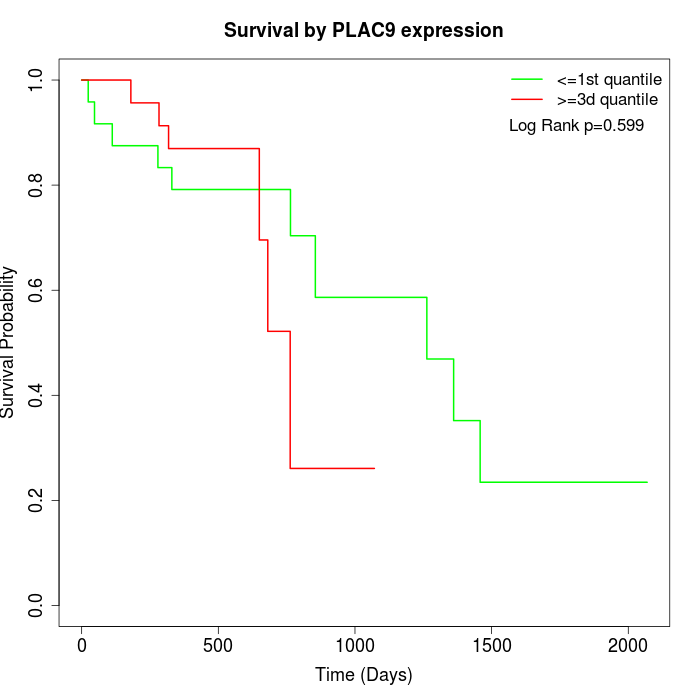 |
| GSE53622 | GSE53624 | TCGA |
Note: Click image to view full size file.
Copy number change of PLAC9:
| Dataset | Gene | EntrezID | Gain | Loss | Normal | Detail |
|---|---|---|---|---|---|---|
| GSE15526 | PLAC9 | 219348 | 2 | 4 | 24 | |
| GSE20123 | PLAC9 | 219348 | 2 | 3 | 25 | |
| GSE43470 | PLAC9 | 219348 | 1 | 7 | 35 | |
| GSE46452 | PLAC9 | 219348 | 0 | 11 | 48 | |
| GSE47630 | PLAC9 | 219348 | 2 | 14 | 24 | |
| GSE54993 | PLAC9 | 219348 | 7 | 0 | 63 | |
| GSE54994 | PLAC9 | 219348 | 1 | 12 | 40 | |
| GSE60625 | PLAC9 | 219348 | 0 | 0 | 11 | |
| GSE74703 | PLAC9 | 219348 | 1 | 4 | 31 | |
| GSE74704 | PLAC9 | 219348 | 1 | 1 | 18 | |
| TCGA | PLAC9 | 219348 | 10 | 24 | 62 |
Total number of gains: 27; Total number of losses: 80; Total Number of normals: 381.
Somatic mutations of PLAC9:
Generating mutation plots.
Highly correlated genes for PLAC9:
Showing top 20/1365 corelated genes with mean PCC>0.5.
| Gene1 | Gene2 | Mean PCC | Num. Datasets | Num. PCC<0 | Num. PCC>0.5 |
|---|---|---|---|---|---|
| PLAC9 | CYP21A2 | 0.90807 | 3 | 0 | 3 |
| PLAC9 | CLEC3B | 0.8969 | 3 | 0 | 3 |
| PLAC9 | OGN | 0.842747 | 5 | 0 | 5 |
| PLAC9 | PDE1C | 0.832612 | 4 | 0 | 4 |
| PLAC9 | AKAP12 | 0.831107 | 4 | 0 | 4 |
| PLAC9 | SORBS2 | 0.816663 | 6 | 0 | 6 |
| PLAC9 | CADM2 | 0.815437 | 4 | 0 | 4 |
| PLAC9 | TMEM100 | 0.813896 | 4 | 0 | 4 |
| PLAC9 | ADAMTS8 | 0.809259 | 6 | 0 | 6 |
| PLAC9 | TNXB | 0.805959 | 3 | 0 | 3 |
| PLAC9 | CASQ2 | 0.798269 | 5 | 0 | 4 |
| PLAC9 | IL6ST | 0.796978 | 5 | 0 | 4 |
| PLAC9 | PLA2G5 | 0.794697 | 4 | 0 | 4 |
| PLAC9 | SYNPO2 | 0.792221 | 5 | 0 | 5 |
| PLAC9 | APOD | 0.787144 | 5 | 0 | 5 |
| PLAC9 | GSN | 0.786568 | 6 | 0 | 6 |
| PLAC9 | NEGR1 | 0.78553 | 5 | 0 | 5 |
| PLAC9 | ACTBL2 | 0.783353 | 3 | 0 | 3 |
| PLAC9 | PARD3B | 0.78213 | 5 | 0 | 5 |
| PLAC9 | ASPA | 0.781933 | 6 | 0 | 5 |
For details and further investigation, click here