| Full name: dermatopontin | Alias Symbol: | ||
| Type: protein-coding gene | Cytoband: 1q24.2 | ||
| Entrez ID: 1805 | HGNC ID: HGNC:3011 | Ensembl Gene: ENSG00000143196 | OMIM ID: 125597 |
Expression of DPT:
| Dataset | Gene | EntrezID | Probe | Log2FC | Adj.pValue | Expression |
|---|---|---|---|---|---|---|
| GSE17351 | DPT | 1805 | 213071_at | -2.5274 | 0.1007 | |
| GSE20347 | DPT | 1805 | 213071_at | -0.5779 | 0.0018 | |
| GSE23400 | DPT | 1805 | 213071_at | -1.3055 | 0.0000 | |
| GSE26886 | DPT | 1805 | 207977_s_at | 0.0674 | 0.7697 | |
| GSE29001 | DPT | 1805 | 213071_at | -0.8135 | 0.0010 | |
| GSE38129 | DPT | 1805 | 213071_at | -1.7037 | 0.0005 | |
| GSE45670 | DPT | 1805 | 213071_at | -3.7960 | 0.0000 | |
| GSE53622 | DPT | 1805 | 29114 | -2.1763 | 0.0000 | |
| GSE53624 | DPT | 1805 | 29114 | -2.1463 | 0.0000 | |
| GSE63941 | DPT | 1805 | 207977_s_at | -0.5237 | 0.0005 | |
| GSE77861 | DPT | 1805 | 207977_s_at | -0.0869 | 0.5792 | |
| GSE97050 | DPT | 1805 | A_23_P200741 | -1.7442 | 0.1280 | |
| SRP064894 | DPT | 1805 | RNAseq | -1.4818 | 0.0110 | |
| SRP133303 | DPT | 1805 | RNAseq | -1.7873 | 0.0017 | |
| SRP159526 | DPT | 1805 | RNAseq | -3.2929 | 0.0000 | |
| SRP219564 | DPT | 1805 | RNAseq | -1.3404 | 0.1529 | |
| TCGA | DPT | 1805 | RNAseq | -1.4840 | 0.0000 |
Upregulated datasets: 0; Downregulated datasets: 9.
Survival by DPT expression:
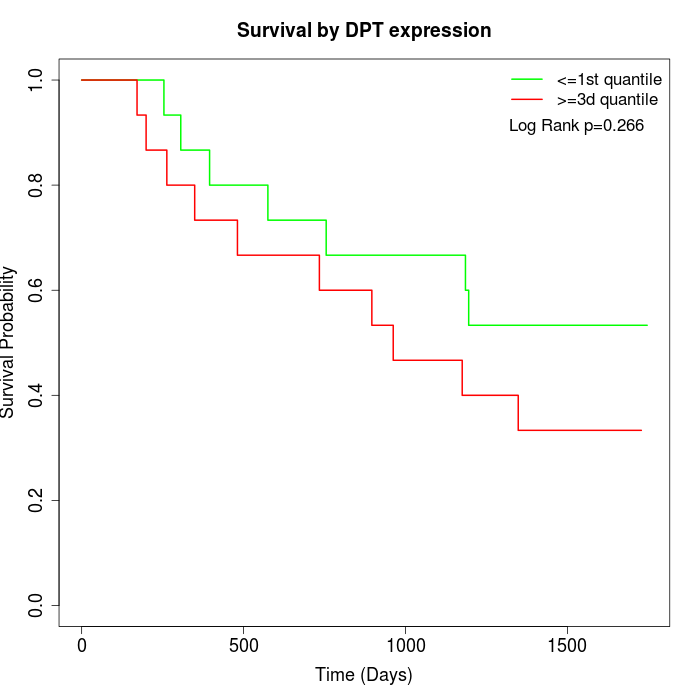 | 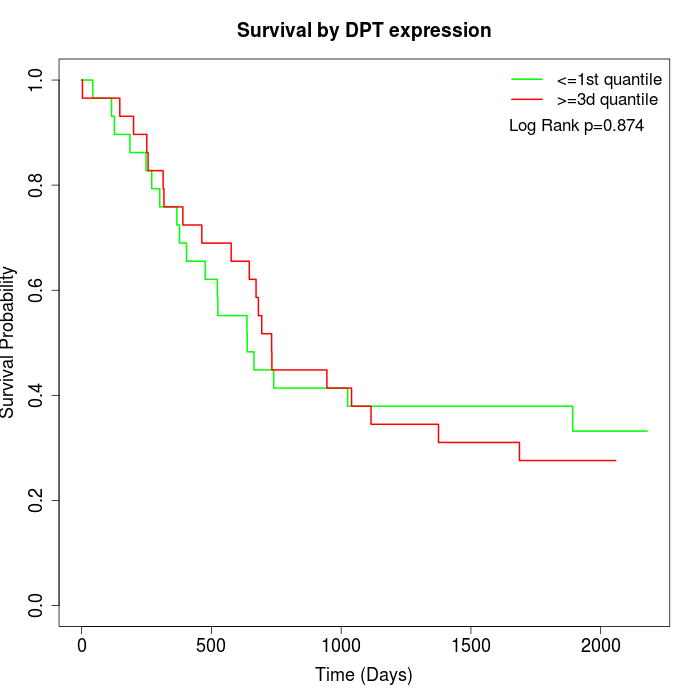 | 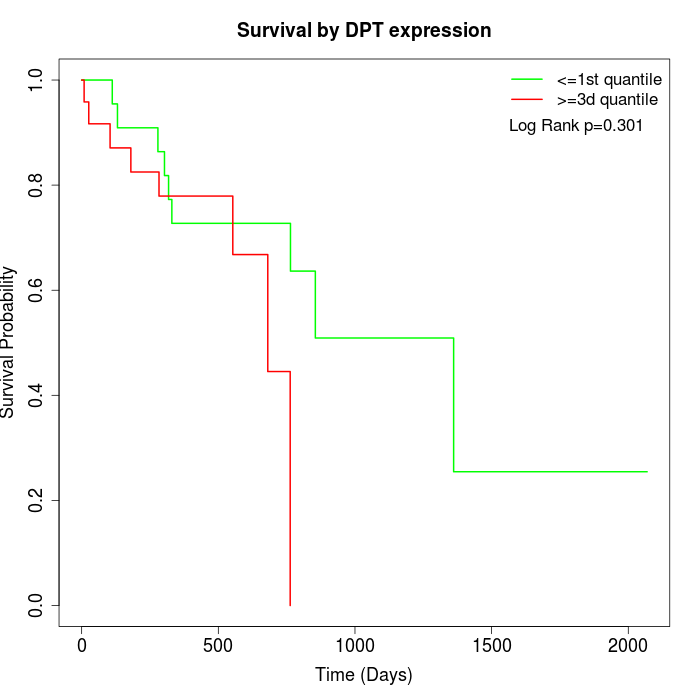 |
| GSE53622 | GSE53624 | TCGA |
Note: Click image to view full size file.
Copy number change of DPT:
| Dataset | Gene | EntrezID | Gain | Loss | Normal | Detail |
|---|---|---|---|---|---|---|
| GSE15526 | DPT | 1805 | 11 | 1 | 18 | |
| GSE20123 | DPT | 1805 | 11 | 1 | 18 | |
| GSE43470 | DPT | 1805 | 7 | 2 | 34 | |
| GSE46452 | DPT | 1805 | 3 | 1 | 55 | |
| GSE47630 | DPT | 1805 | 14 | 0 | 26 | |
| GSE54993 | DPT | 1805 | 0 | 6 | 64 | |
| GSE54994 | DPT | 1805 | 16 | 0 | 37 | |
| GSE60625 | DPT | 1805 | 0 | 0 | 11 | |
| GSE74703 | DPT | 1805 | 7 | 2 | 27 | |
| GSE74704 | DPT | 1805 | 5 | 0 | 15 | |
| TCGA | DPT | 1805 | 43 | 3 | 50 |
Total number of gains: 117; Total number of losses: 16; Total Number of normals: 355.
Somatic mutations of DPT:
Generating mutation plots.
Highly correlated genes for DPT:
Showing top 20/1249 corelated genes with mean PCC>0.5.
| Gene1 | Gene2 | Mean PCC | Num. Datasets | Num. PCC<0 | Num. PCC>0.5 |
|---|---|---|---|---|---|
| DPT | NEGR1 | 0.864262 | 7 | 0 | 7 |
| DPT | CYP21A2 | 0.864079 | 3 | 0 | 3 |
| DPT | CLEC3B | 0.847096 | 3 | 0 | 3 |
| DPT | MYOC | 0.843211 | 9 | 0 | 9 |
| DPT | SORCS1 | 0.839926 | 4 | 0 | 4 |
| DPT | ARHGAP6 | 0.837607 | 10 | 0 | 10 |
| DPT | CILP | 0.823651 | 10 | 0 | 10 |
| DPT | XKR4 | 0.820323 | 5 | 0 | 5 |
| DPT | AFF3 | 0.816498 | 3 | 0 | 3 |
| DPT | ABCA8 | 0.80599 | 10 | 0 | 10 |
| DPT | FXYD1 | 0.796488 | 9 | 0 | 8 |
| DPT | LINC01082 | 0.795508 | 6 | 0 | 6 |
| DPT | AOC3 | 0.792998 | 10 | 0 | 10 |
| DPT | ATP1A2 | 0.785607 | 10 | 0 | 9 |
| DPT | ITIH5 | 0.783116 | 9 | 0 | 9 |
| DPT | BHMT2 | 0.782922 | 10 | 0 | 10 |
| DPT | CBX7 | 0.782065 | 9 | 0 | 9 |
| DPT | C7 | 0.781669 | 10 | 0 | 9 |
| DPT | SLIT2 | 0.780743 | 8 | 0 | 8 |
| DPT | ADAMTSL1 | 0.780235 | 6 | 0 | 6 |
For details and further investigation, click here