| Full name: Fas ligand | Alias Symbol: FasL|CD178 | ||
| Type: protein-coding gene | Cytoband: 1q24.3 | ||
| Entrez ID: 356 | HGNC ID: HGNC:11936 | Ensembl Gene: ENSG00000117560 | OMIM ID: 134638 |
FASLG involved pathways:
Expression of FASLG:
| Dataset | Gene | EntrezID | Probe | Log2FC | Adj.pValue | Expression |
|---|---|---|---|---|---|---|
| GSE17351 | FASLG | 356 | 210865_at | -0.0323 | 0.9135 | |
| GSE20347 | FASLG | 356 | 210865_at | -0.0775 | 0.2580 | |
| GSE23400 | FASLG | 356 | 210865_at | -0.1285 | 0.0038 | |
| GSE26886 | FASLG | 356 | 210865_at | -0.0992 | 0.5690 | |
| GSE29001 | FASLG | 356 | 211333_s_at | -0.0384 | 0.8360 | |
| GSE38129 | FASLG | 356 | 210865_at | -0.1727 | 0.1456 | |
| GSE45670 | FASLG | 356 | 210865_at | 0.0250 | 0.9179 | |
| GSE53622 | FASLG | 356 | 25807 | -0.0240 | 0.8703 | |
| GSE53624 | FASLG | 356 | 25807 | -0.1171 | 0.3702 | |
| GSE63941 | FASLG | 356 | 210865_at | 0.3316 | 0.0391 | |
| GSE77861 | FASLG | 356 | 210865_at | -0.1825 | 0.1463 | |
| GSE97050 | FASLG | 356 | A_23_P369815 | 0.0880 | 0.6847 | |
| SRP133303 | FASLG | 356 | RNAseq | -0.2399 | 0.5843 | |
| TCGA | FASLG | 356 | RNAseq | 0.5199 | 0.2772 |
Upregulated datasets: 0; Downregulated datasets: 0.
Survival by FASLG expression:
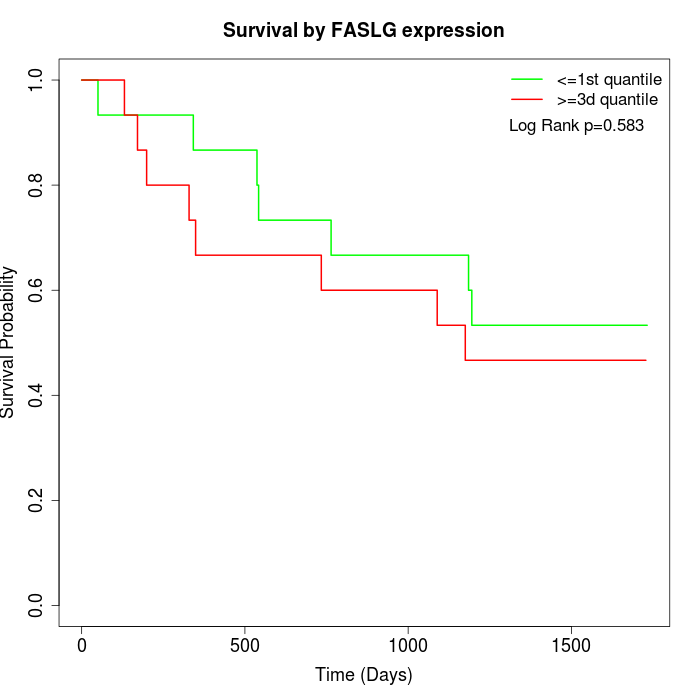 | 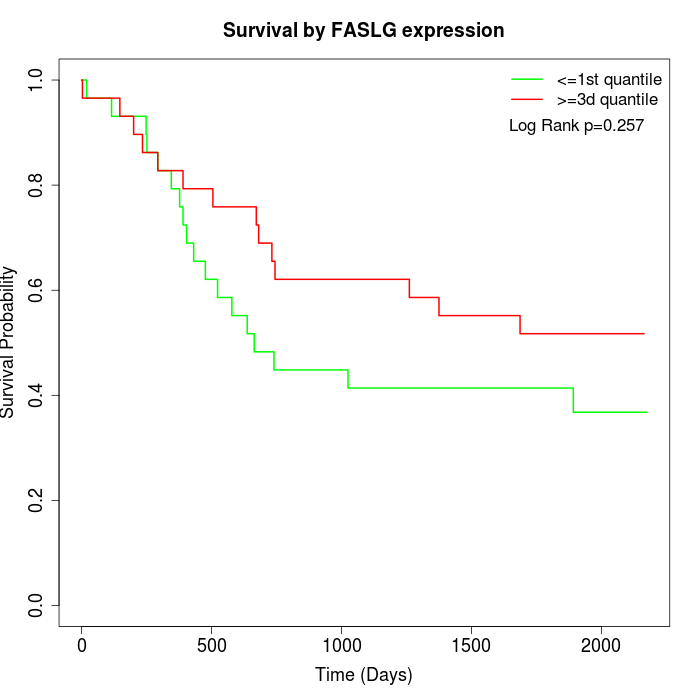 | 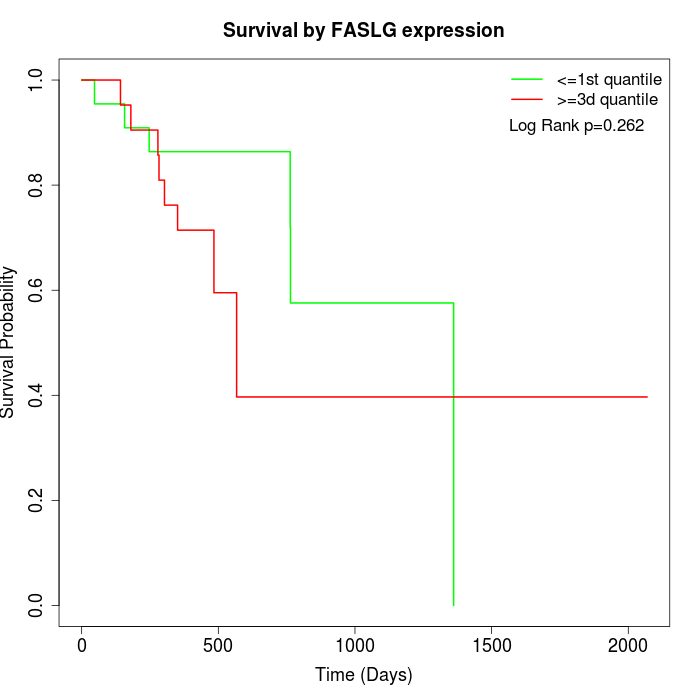 |
| GSE53622 | GSE53624 | TCGA |
Note: Click image to view full size file.
Copy number change of FASLG:
| Dataset | Gene | EntrezID | Gain | Loss | Normal | Detail |
|---|---|---|---|---|---|---|
| GSE15526 | FASLG | 356 | 13 | 0 | 17 | |
| GSE20123 | FASLG | 356 | 13 | 0 | 17 | |
| GSE43470 | FASLG | 356 | 7 | 2 | 34 | |
| GSE46452 | FASLG | 356 | 3 | 1 | 55 | |
| GSE47630 | FASLG | 356 | 14 | 0 | 26 | |
| GSE54993 | FASLG | 356 | 0 | 6 | 64 | |
| GSE54994 | FASLG | 356 | 16 | 0 | 37 | |
| GSE60625 | FASLG | 356 | 0 | 0 | 11 | |
| GSE74703 | FASLG | 356 | 7 | 2 | 27 | |
| GSE74704 | FASLG | 356 | 6 | 0 | 14 | |
| TCGA | FASLG | 356 | 41 | 3 | 52 |
Total number of gains: 120; Total number of losses: 14; Total Number of normals: 354.
Somatic mutations of FASLG:
Generating mutation plots.
Highly correlated genes for FASLG:
Showing top 20/567 corelated genes with mean PCC>0.5.
| Gene1 | Gene2 | Mean PCC | Num. Datasets | Num. PCC<0 | Num. PCC>0.5 |
|---|---|---|---|---|---|
| FASLG | MAGEA8 | 0.779163 | 3 | 0 | 3 |
| FASLG | GUCY2C | 0.733024 | 3 | 0 | 3 |
| FASLG | ACSBG2 | 0.720891 | 4 | 0 | 3 |
| FASLG | SPTA1 | 0.719669 | 4 | 0 | 3 |
| FASLG | CRABP1 | 0.718 | 3 | 0 | 3 |
| FASLG | BRSK1 | 0.717949 | 3 | 0 | 3 |
| FASLG | CLCA1 | 0.710382 | 4 | 0 | 4 |
| FASLG | DAGLA | 0.709069 | 5 | 0 | 5 |
| FASLG | INHBC | 0.708851 | 3 | 0 | 3 |
| FASLG | HOXA11-AS | 0.705431 | 3 | 0 | 3 |
| FASLG | RNF5 | 0.70533 | 4 | 0 | 4 |
| FASLG | KLK2 | 0.703125 | 5 | 0 | 4 |
| FASLG | MPP3 | 0.701388 | 3 | 0 | 3 |
| FASLG | KCNAB3 | 0.699214 | 6 | 0 | 5 |
| FASLG | CELF3 | 0.693997 | 8 | 0 | 8 |
| FASLG | AOC2 | 0.692894 | 5 | 0 | 4 |
| FASLG | CDH23 | 0.692745 | 3 | 0 | 3 |
| FASLG | IL1RAPL2 | 0.692386 | 5 | 0 | 4 |
| FASLG | PGC | 0.689254 | 4 | 0 | 3 |
| FASLG | TNXB | 0.687397 | 4 | 0 | 4 |
For details and further investigation, click here