| Full name: F-box and leucine rich repeat protein 18 | Alias Symbol: FLJ11467|Fbl18 | ||
| Type: protein-coding gene | Cytoband: 7p22.1 | ||
| Entrez ID: 80028 | HGNC ID: HGNC:21874 | Ensembl Gene: ENSG00000155034 | OMIM ID: 609084 |
Expression of FBXL18:
| Dataset | Gene | EntrezID | Probe | Log2FC | Adj.pValue | Expression |
|---|---|---|---|---|---|---|
| GSE17351 | FBXL18 | 80028 | 1553359_at | 0.1642 | 0.5570 | |
| GSE20347 | FBXL18 | 80028 | 215068_s_at | 0.3361 | 0.0306 | |
| GSE23400 | FBXL18 | 80028 | 220896_at | -0.0520 | 0.0898 | |
| GSE26886 | FBXL18 | 80028 | 1553359_at | 0.2058 | 0.1705 | |
| GSE29001 | FBXL18 | 80028 | 220896_at | 0.1178 | 0.5905 | |
| GSE38129 | FBXL18 | 80028 | 215068_s_at | 0.2448 | 0.1277 | |
| GSE45670 | FBXL18 | 80028 | 1553361_x_at | 0.2165 | 0.0491 | |
| GSE53622 | FBXL18 | 80028 | 28639 | 0.5315 | 0.0000 | |
| GSE53624 | FBXL18 | 80028 | 28639 | 0.5697 | 0.0000 | |
| GSE63941 | FBXL18 | 80028 | 227500_at | 0.4693 | 0.2081 | |
| GSE77861 | FBXL18 | 80028 | 1553359_at | 0.0534 | 0.6123 | |
| GSE97050 | FBXL18 | 80028 | A_24_P307854 | 0.6487 | 0.1187 | |
| SRP007169 | FBXL18 | 80028 | RNAseq | 0.6518 | 0.0966 | |
| SRP008496 | FBXL18 | 80028 | RNAseq | 0.7789 | 0.0097 | |
| SRP064894 | FBXL18 | 80028 | RNAseq | 0.5071 | 0.0082 | |
| SRP133303 | FBXL18 | 80028 | RNAseq | 0.4901 | 0.0001 | |
| SRP159526 | FBXL18 | 80028 | RNAseq | 0.4624 | 0.0984 | |
| SRP193095 | FBXL18 | 80028 | RNAseq | 0.6229 | 0.0000 | |
| SRP219564 | FBXL18 | 80028 | RNAseq | 0.4446 | 0.2004 | |
| TCGA | FBXL18 | 80028 | RNAseq | 0.0503 | 0.4516 |
Upregulated datasets: 0; Downregulated datasets: 0.
Survival by FBXL18 expression:
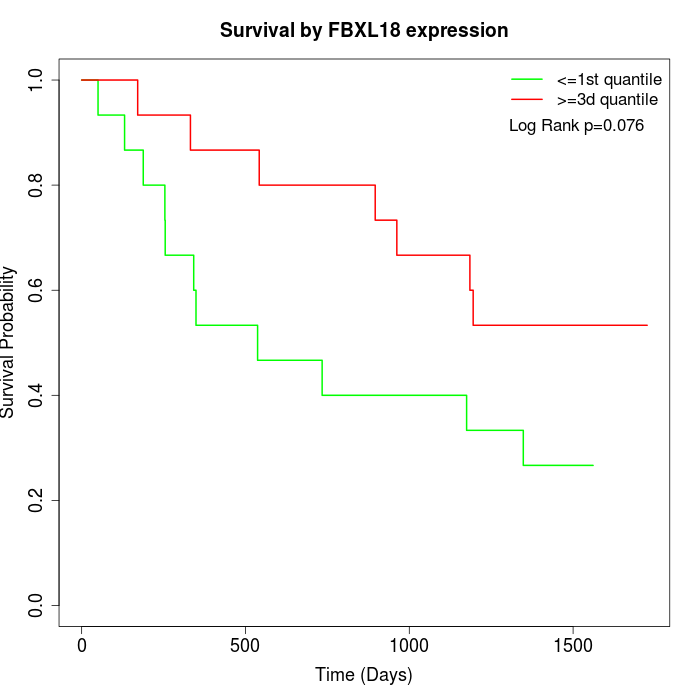 | 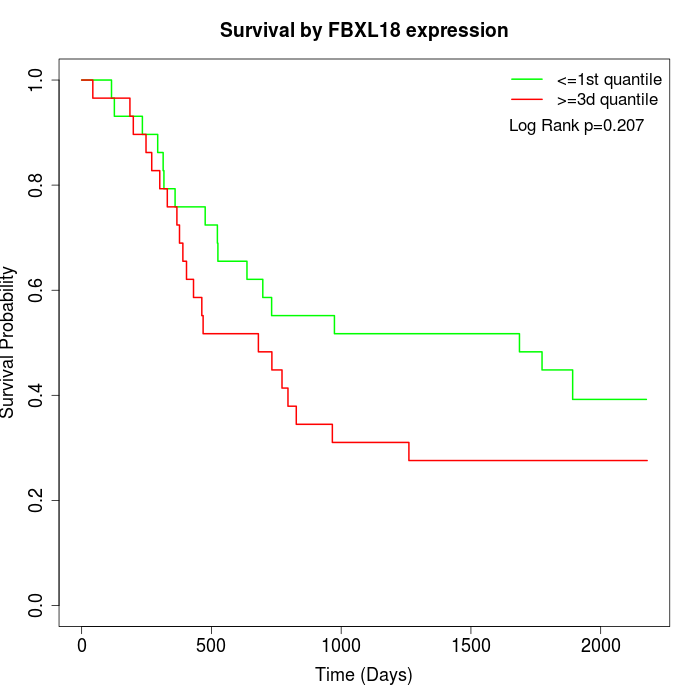 | 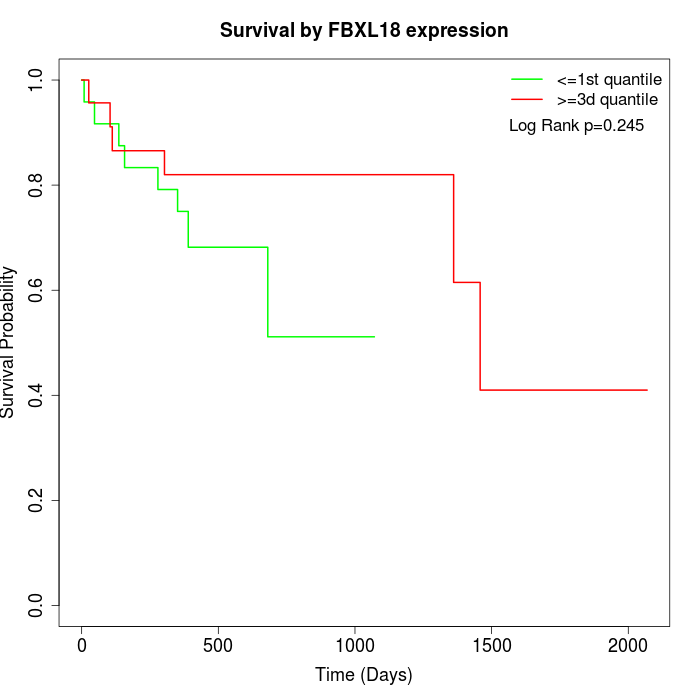 |
| GSE53622 | GSE53624 | TCGA |
Note: Click image to view full size file.
Copy number change of FBXL18:
| Dataset | Gene | EntrezID | Gain | Loss | Normal | Detail |
|---|---|---|---|---|---|---|
| GSE15526 | FBXL18 | 80028 | 14 | 1 | 15 | |
| GSE20123 | FBXL18 | 80028 | 14 | 1 | 15 | |
| GSE43470 | FBXL18 | 80028 | 6 | 1 | 36 | |
| GSE46452 | FBXL18 | 80028 | 13 | 1 | 45 | |
| GSE47630 | FBXL18 | 80028 | 9 | 1 | 30 | |
| GSE54993 | FBXL18 | 80028 | 0 | 6 | 64 | |
| GSE54994 | FBXL18 | 80028 | 22 | 1 | 30 | |
| GSE60625 | FBXL18 | 80028 | 0 | 0 | 11 | |
| GSE74703 | FBXL18 | 80028 | 6 | 0 | 30 | |
| GSE74704 | FBXL18 | 80028 | 9 | 0 | 11 | |
| TCGA | FBXL18 | 80028 | 56 | 5 | 35 |
Total number of gains: 149; Total number of losses: 17; Total Number of normals: 322.
Somatic mutations of FBXL18:
Generating mutation plots.
Highly correlated genes for FBXL18:
Showing top 20/631 corelated genes with mean PCC>0.5.
| Gene1 | Gene2 | Mean PCC | Num. Datasets | Num. PCC<0 | Num. PCC>0.5 |
|---|---|---|---|---|---|
| FBXL18 | LZTS1 | 0.769474 | 3 | 0 | 3 |
| FBXL18 | SYT5 | 0.728255 | 3 | 0 | 3 |
| FBXL18 | KCNH6 | 0.708475 | 3 | 0 | 3 |
| FBXL18 | TSGA13 | 0.699667 | 3 | 0 | 3 |
| FBXL18 | DOC2B | 0.6935 | 4 | 0 | 4 |
| FBXL18 | TNFRSF13C | 0.687616 | 4 | 0 | 4 |
| FBXL18 | ORAI2 | 0.682172 | 3 | 0 | 3 |
| FBXL18 | OR6A2 | 0.68185 | 4 | 0 | 4 |
| FBXL18 | SCGN | 0.681036 | 3 | 0 | 3 |
| FBXL18 | CREB3L1 | 0.677669 | 3 | 0 | 3 |
| FBXL18 | KRT84 | 0.674728 | 5 | 0 | 5 |
| FBXL18 | KCNN1 | 0.673764 | 5 | 0 | 4 |
| FBXL18 | SPIN2A | 0.673205 | 3 | 0 | 3 |
| FBXL18 | LYZL6 | 0.672383 | 4 | 0 | 4 |
| FBXL18 | BEST3 | 0.667462 | 3 | 0 | 3 |
| FBXL18 | SERPINA6 | 0.667037 | 5 | 0 | 4 |
| FBXL18 | SPTB | 0.665969 | 3 | 0 | 3 |
| FBXL18 | SOST | 0.662955 | 3 | 0 | 3 |
| FBXL18 | KIF21B | 0.662618 | 3 | 0 | 3 |
| FBXL18 | TMPRSS5 | 0.661904 | 5 | 0 | 5 |
For details and further investigation, click here