| Full name: F-box protein 42 | Alias Symbol: KIAA1332|Fbx42 | ||
| Type: protein-coding gene | Cytoband: 1p36.13 | ||
| Entrez ID: 54455 | HGNC ID: HGNC:29249 | Ensembl Gene: ENSG00000037637 | OMIM ID: 609109 |
Screen Evidence:
| |||
Expression of FBXO42:
| Dataset | Gene | EntrezID | Probe | Log2FC | Adj.pValue | Expression |
|---|---|---|---|---|---|---|
| GSE17351 | FBXO42 | 54455 | 221813_at | -0.3142 | 0.3736 | |
| GSE20347 | FBXO42 | 54455 | 221813_at | -0.0961 | 0.2133 | |
| GSE23400 | FBXO42 | 54455 | 221812_at | -0.2429 | 0.0000 | |
| GSE26886 | FBXO42 | 54455 | 221813_at | -0.0184 | 0.9363 | |
| GSE29001 | FBXO42 | 54455 | 47773_at | -0.5525 | 0.0222 | |
| GSE38129 | FBXO42 | 54455 | 221813_at | -0.0575 | 0.4446 | |
| GSE45670 | FBXO42 | 54455 | 221813_at | -0.1534 | 0.3348 | |
| GSE53622 | FBXO42 | 54455 | 36504 | -0.3519 | 0.0000 | |
| GSE53624 | FBXO42 | 54455 | 36504 | -0.3081 | 0.0000 | |
| GSE63941 | FBXO42 | 54455 | 221813_at | 0.1400 | 0.6964 | |
| GSE77861 | FBXO42 | 54455 | 221813_at | -0.3122 | 0.0186 | |
| GSE97050 | FBXO42 | 54455 | A_24_P333494 | -0.2096 | 0.4621 | |
| SRP007169 | FBXO42 | 54455 | RNAseq | -1.2089 | 0.0209 | |
| SRP008496 | FBXO42 | 54455 | RNAseq | -1.0080 | 0.0012 | |
| SRP064894 | FBXO42 | 54455 | RNAseq | -0.6970 | 0.0000 | |
| SRP133303 | FBXO42 | 54455 | RNAseq | -0.3892 | 0.0050 | |
| SRP159526 | FBXO42 | 54455 | RNAseq | -0.5667 | 0.0247 | |
| SRP193095 | FBXO42 | 54455 | RNAseq | -0.4436 | 0.0001 | |
| SRP219564 | FBXO42 | 54455 | RNAseq | -0.6378 | 0.0236 | |
| TCGA | FBXO42 | 54455 | RNAseq | -0.0611 | 0.2296 |
Upregulated datasets: 0; Downregulated datasets: 2.
Survival by FBXO42 expression:
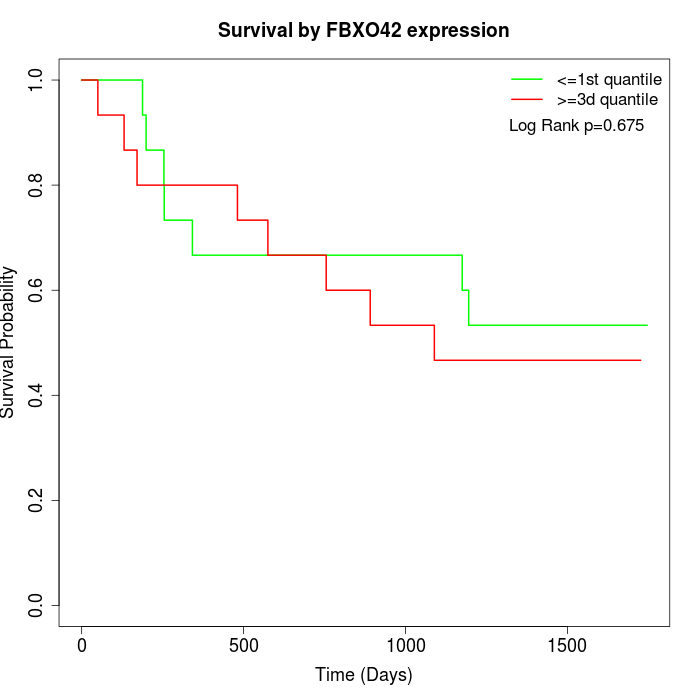 | 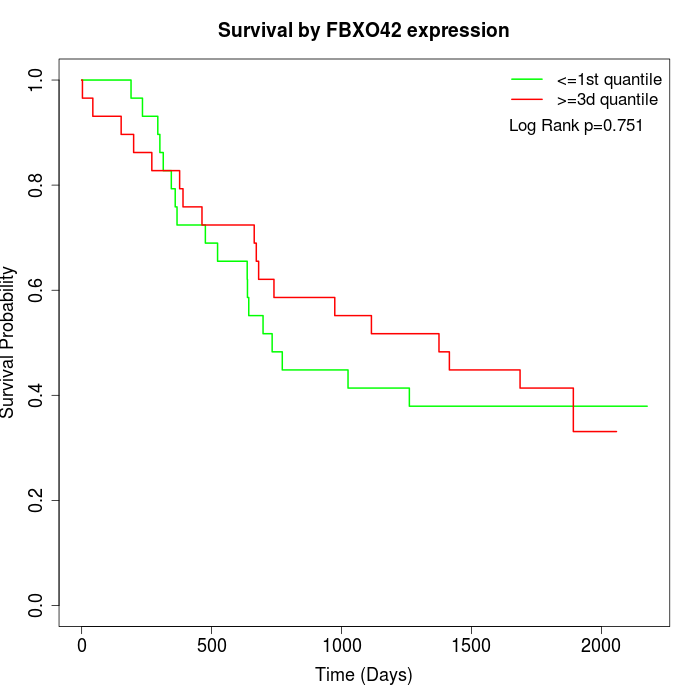 | 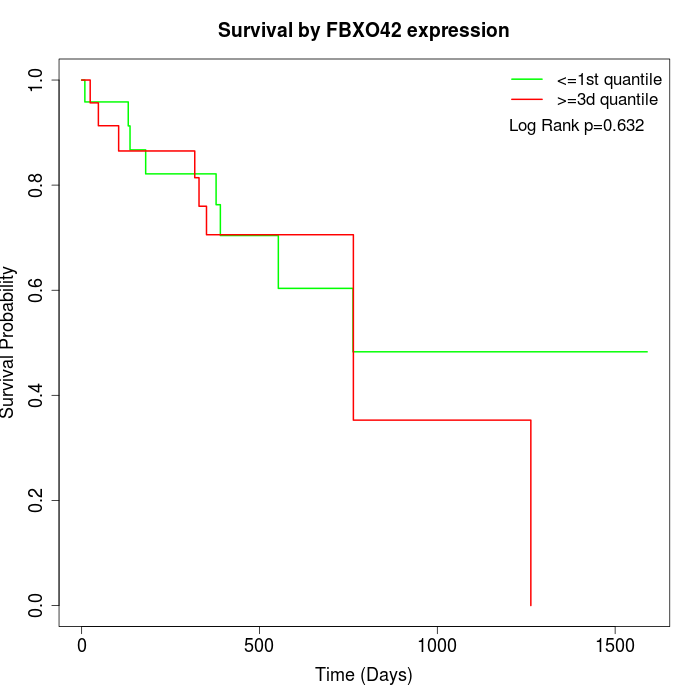 |
| GSE53622 | GSE53624 | TCGA |
Note: Click image to view full size file.
Copy number change of FBXO42:
| Dataset | Gene | EntrezID | Gain | Loss | Normal | Detail |
|---|---|---|---|---|---|---|
| GSE15526 | FBXO42 | 54455 | 1 | 5 | 24 | |
| GSE20123 | FBXO42 | 54455 | 1 | 4 | 25 | |
| GSE43470 | FBXO42 | 54455 | 1 | 8 | 34 | |
| GSE46452 | FBXO42 | 54455 | 7 | 1 | 51 | |
| GSE47630 | FBXO42 | 54455 | 8 | 3 | 29 | |
| GSE54993 | FBXO42 | 54455 | 3 | 1 | 66 | |
| GSE54994 | FBXO42 | 54455 | 10 | 5 | 38 | |
| GSE60625 | FBXO42 | 54455 | 0 | 0 | 11 | |
| GSE74703 | FBXO42 | 54455 | 1 | 5 | 30 | |
| GSE74704 | FBXO42 | 54455 | 1 | 0 | 19 | |
| TCGA | FBXO42 | 54455 | 11 | 23 | 62 |
Total number of gains: 44; Total number of losses: 55; Total Number of normals: 389.
Somatic mutations of FBXO42:
Generating mutation plots.
Highly correlated genes for FBXO42:
Showing top 20/778 corelated genes with mean PCC>0.5.
| Gene1 | Gene2 | Mean PCC | Num. Datasets | Num. PCC<0 | Num. PCC>0.5 |
|---|---|---|---|---|---|
| FBXO42 | EPG5 | 0.773457 | 3 | 0 | 3 |
| FBXO42 | DDI2 | 0.773189 | 3 | 0 | 3 |
| FBXO42 | ZNF416 | 0.75451 | 4 | 0 | 4 |
| FBXO42 | IPO8 | 0.744695 | 3 | 0 | 3 |
| FBXO42 | LIMCH1 | 0.729707 | 3 | 0 | 3 |
| FBXO42 | KIAA2026 | 0.728412 | 3 | 0 | 3 |
| FBXO42 | CNR1 | 0.725529 | 3 | 0 | 3 |
| FBXO42 | PITHD1 | 0.72048 | 6 | 0 | 5 |
| FBXO42 | CYP2C19 | 0.719205 | 4 | 0 | 4 |
| FBXO42 | PPM1L | 0.714745 | 3 | 0 | 3 |
| FBXO42 | AP4E1 | 0.711436 | 3 | 0 | 3 |
| FBXO42 | BMP2K | 0.70537 | 4 | 0 | 4 |
| FBXO42 | CXXC5 | 0.704087 | 5 | 0 | 4 |
| FBXO42 | PDCD4 | 0.702514 | 3 | 0 | 3 |
| FBXO42 | C11orf68 | 0.699951 | 3 | 0 | 3 |
| FBXO42 | INPP5B | 0.698262 | 3 | 0 | 3 |
| FBXO42 | SMURF1 | 0.698066 | 3 | 0 | 3 |
| FBXO42 | ZNF33A | 0.696779 | 3 | 0 | 3 |
| FBXO42 | PPP2CA | 0.695321 | 3 | 0 | 3 |
| FBXO42 | CCDC12 | 0.695225 | 4 | 0 | 4 |
For details and further investigation, click here