| Full name: fidgetin, microtubule severing factor | Alias Symbol: | ||
| Type: protein-coding gene | Cytoband: 2q24.3 | ||
| Entrez ID: 55137 | HGNC ID: HGNC:13285 | Ensembl Gene: ENSG00000182263 | OMIM ID: 605295 |
Expression of FIGN:
| Dataset | Gene | EntrezID | Probe | Log2FC | Adj.pValue | Expression |
|---|---|---|---|---|---|---|
| GSE17351 | FIGN | 55137 | 242828_at | -0.5668 | 0.6019 | |
| GSE26886 | FIGN | 55137 | 242828_at | 0.2196 | 0.4950 | |
| GSE45670 | FIGN | 55137 | 242828_at | -0.9448 | 0.0475 | |
| GSE53622 | FIGN | 55137 | 16195 | -0.9046 | 0.0001 | |
| GSE53624 | FIGN | 55137 | 41790 | -0.5634 | 0.0004 | |
| GSE63941 | FIGN | 55137 | 242828_at | -0.8585 | 0.3466 | |
| GSE77861 | FIGN | 55137 | 222956_at | -0.1182 | 0.2512 | |
| GSE97050 | FIGN | 55137 | A_32_P397824 | -1.0464 | 0.0631 | |
| SRP007169 | FIGN | 55137 | RNAseq | 2.0854 | 0.0417 | |
| SRP064894 | FIGN | 55137 | RNAseq | -0.1768 | 0.6780 | |
| SRP133303 | FIGN | 55137 | RNAseq | -0.0677 | 0.8645 | |
| SRP159526 | FIGN | 55137 | RNAseq | -0.6830 | 0.2435 | |
| SRP219564 | FIGN | 55137 | RNAseq | 0.3301 | 0.6757 | |
| TCGA | FIGN | 55137 | RNAseq | -0.5779 | 0.1248 |
Upregulated datasets: 1; Downregulated datasets: 0.
Survival by FIGN expression:
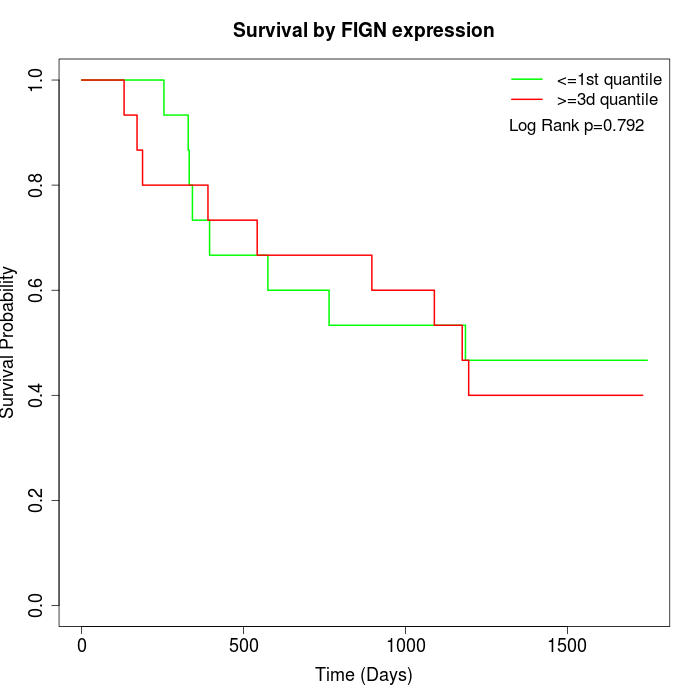 | 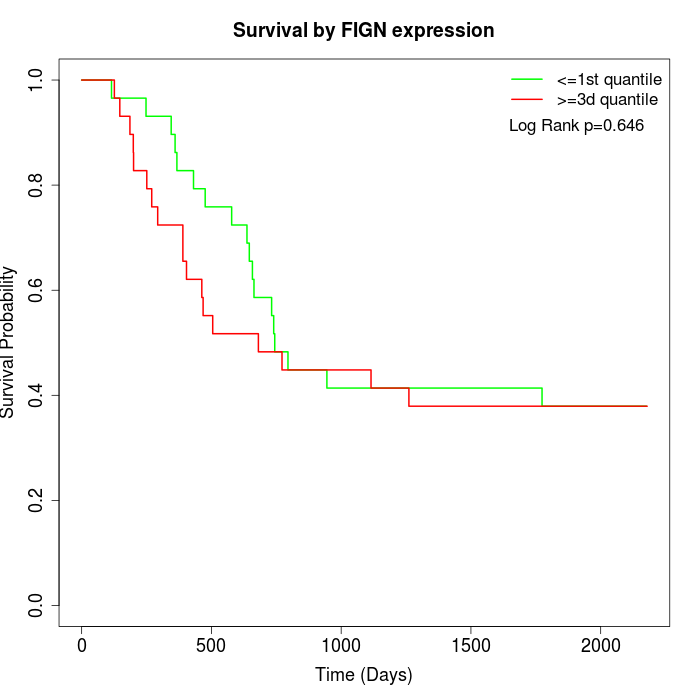 | 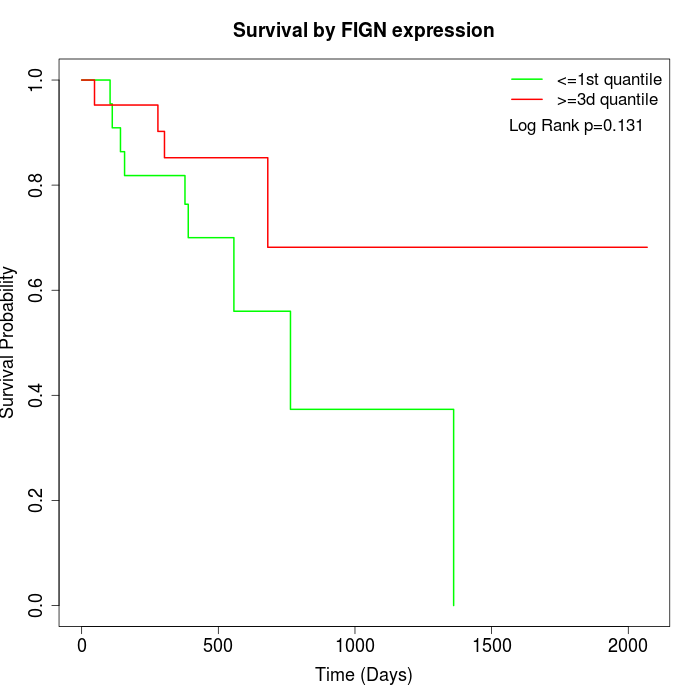 |
| GSE53622 | GSE53624 | TCGA |
Note: Click image to view full size file.
Copy number change of FIGN:
| Dataset | Gene | EntrezID | Gain | Loss | Normal | Detail |
|---|---|---|---|---|---|---|
| GSE15526 | FIGN | 55137 | 5 | 1 | 24 | |
| GSE20123 | FIGN | 55137 | 5 | 1 | 24 | |
| GSE43470 | FIGN | 55137 | 5 | 1 | 37 | |
| GSE46452 | FIGN | 55137 | 1 | 4 | 54 | |
| GSE47630 | FIGN | 55137 | 5 | 3 | 32 | |
| GSE54993 | FIGN | 55137 | 0 | 5 | 65 | |
| GSE54994 | FIGN | 55137 | 11 | 2 | 40 | |
| GSE60625 | FIGN | 55137 | 0 | 3 | 8 | |
| GSE74703 | FIGN | 55137 | 4 | 1 | 31 | |
| GSE74704 | FIGN | 55137 | 3 | 0 | 17 | |
| TCGA | FIGN | 55137 | 24 | 9 | 63 |
Total number of gains: 63; Total number of losses: 30; Total Number of normals: 395.
Somatic mutations of FIGN:
Generating mutation plots.
Highly correlated genes for FIGN:
Showing top 20/422 corelated genes with mean PCC>0.5.
| Gene1 | Gene2 | Mean PCC | Num. Datasets | Num. PCC<0 | Num. PCC>0.5 |
|---|---|---|---|---|---|
| FIGN | DUSP3 | 0.762708 | 3 | 0 | 3 |
| FIGN | SGTB | 0.744786 | 3 | 0 | 3 |
| FIGN | HDAC9 | 0.739431 | 3 | 0 | 3 |
| FIGN | SMARCA5 | 0.726861 | 3 | 0 | 3 |
| FIGN | SRR | 0.724724 | 3 | 0 | 3 |
| FIGN | ZCCHC24 | 0.723721 | 5 | 0 | 5 |
| FIGN | FAM98B | 0.716367 | 3 | 0 | 3 |
| FIGN | SRPX | 0.710797 | 3 | 0 | 3 |
| FIGN | PSIP1 | 0.699408 | 4 | 0 | 3 |
| FIGN | CD59 | 0.697374 | 3 | 0 | 3 |
| FIGN | RPS14 | 0.692908 | 3 | 0 | 3 |
| FIGN | RHOBTB3 | 0.692312 | 4 | 0 | 3 |
| FIGN | HNRNPH3 | 0.691222 | 3 | 0 | 3 |
| FIGN | PLA2G5 | 0.69018 | 3 | 0 | 3 |
| FIGN | GNG2 | 0.687416 | 4 | 0 | 4 |
| FIGN | TLE1 | 0.687054 | 3 | 0 | 3 |
| FIGN | PHYH | 0.686988 | 4 | 0 | 3 |
| FIGN | FIBIN | 0.686738 | 4 | 0 | 3 |
| FIGN | FLNC | 0.686158 | 4 | 0 | 4 |
| FIGN | CAMK2G | 0.685734 | 3 | 0 | 3 |
For details and further investigation, click here