| Full name: galanin and GMAP prepropeptide | Alias Symbol: GMAP|GAL-GMAP|GLNN | ||
| Type: protein-coding gene | Cytoband: 11q13.2 | ||
| Entrez ID: 51083 | HGNC ID: HGNC:4114 | Ensembl Gene: ENSG00000069482 | OMIM ID: 137035 |
| Related drugs: ESTRADIOL BENZOATE, HYDROCORTISONE, LIOTHYRONINE SODIUM, PRASTERONE... [more] | |||
Expression of GAL:
| Dataset | Gene | EntrezID | Probe | Log2FC | Adj.pValue | Expression |
|---|---|---|---|---|---|---|
| GSE17351 | GAL | 51083 | 214240_at | 1.4548 | 0.3468 | |
| GSE20347 | GAL | 51083 | 214240_at | 1.4809 | 0.0035 | |
| GSE23400 | GAL | 51083 | 214240_at | 0.2090 | 0.0456 | |
| GSE26886 | GAL | 51083 | 214240_at | 0.8466 | 0.0865 | |
| GSE29001 | GAL | 51083 | 207466_at | 0.1382 | 0.3671 | |
| GSE38129 | GAL | 51083 | 214240_at | 1.1143 | 0.0043 | |
| GSE45670 | GAL | 51083 | 214240_at | 1.5953 | 0.0075 | |
| GSE53622 | GAL | 51083 | 14041 | 1.8544 | 0.0000 | |
| GSE53624 | GAL | 51083 | 14041 | 2.4758 | 0.0000 | |
| GSE63941 | GAL | 51083 | 214240_at | 0.2703 | 0.8994 | |
| GSE77861 | GAL | 51083 | 207466_at | -0.0952 | 0.3828 | |
| GSE97050 | GAL | 51083 | A_33_P3269976 | -0.0417 | 0.8802 | |
| SRP219564 | GAL | 51083 | RNAseq | 1.5007 | 0.3231 | |
| TCGA | GAL | 51083 | RNAseq | 0.7463 | 0.1186 |
Upregulated datasets: 5; Downregulated datasets: 0.
Survival by GAL expression:
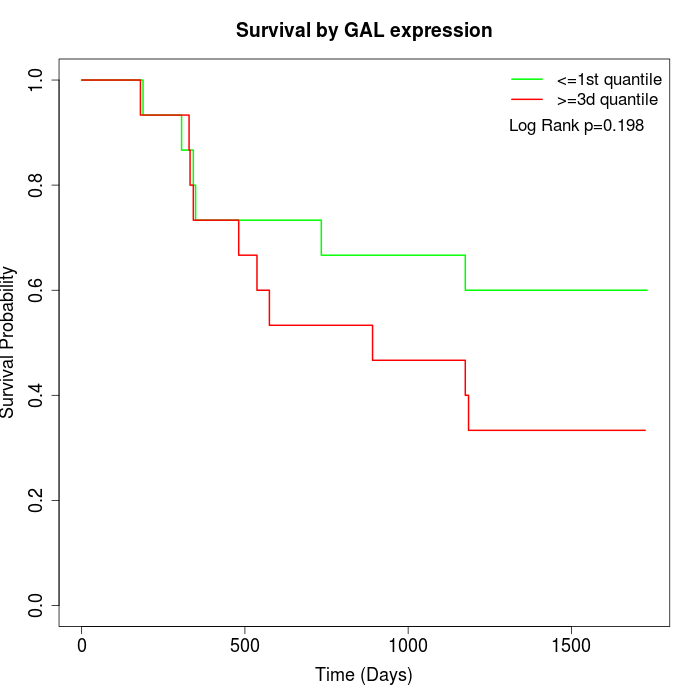 | 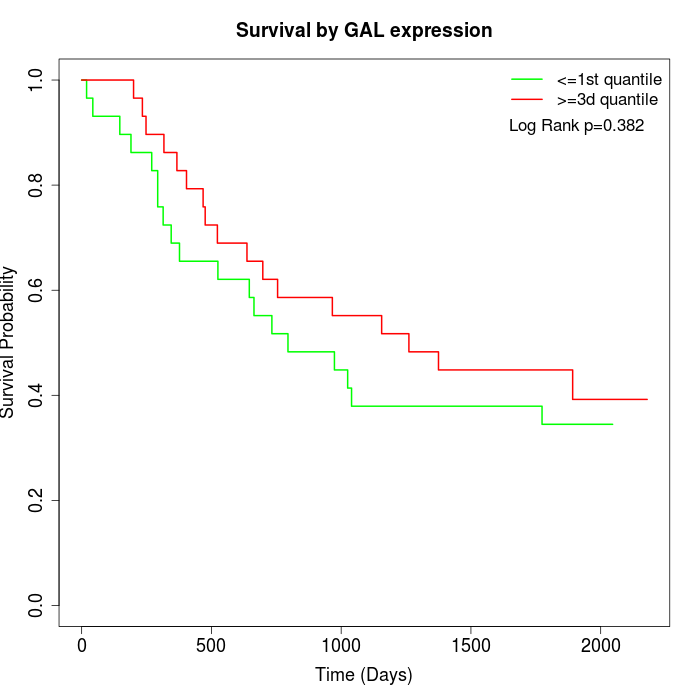 | 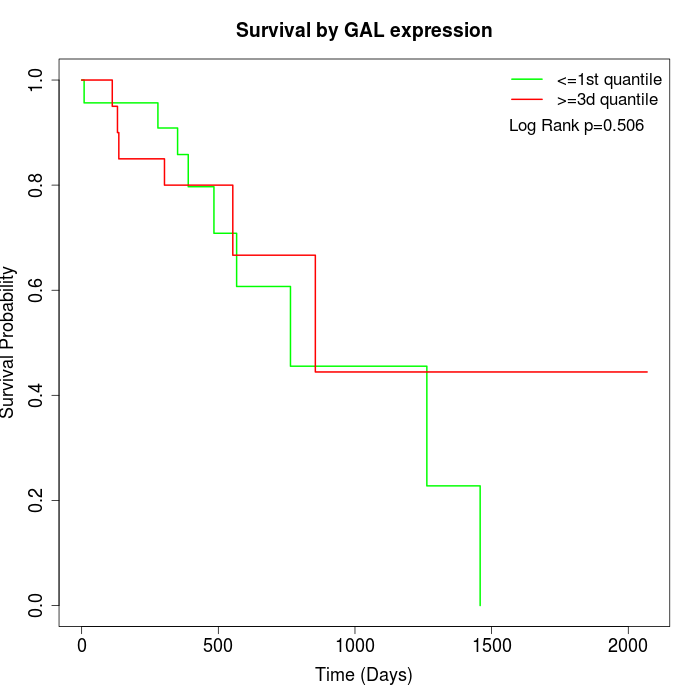 |
| GSE53622 | GSE53624 | TCGA |
Note: Click image to view full size file.
Copy number change of GAL:
| Dataset | Gene | EntrezID | Gain | Loss | Normal | Detail |
|---|---|---|---|---|---|---|
| GSE15526 | GAL | 51083 | 11 | 3 | 16 | |
| GSE20123 | GAL | 51083 | 11 | 3 | 16 | |
| GSE43470 | GAL | 51083 | 7 | 3 | 33 | |
| GSE46452 | GAL | 51083 | 22 | 2 | 35 | |
| GSE47630 | GAL | 51083 | 14 | 3 | 23 | |
| GSE54993 | GAL | 51083 | 1 | 11 | 58 | |
| GSE54994 | GAL | 51083 | 18 | 4 | 31 | |
| GSE60625 | GAL | 51083 | 0 | 3 | 8 | |
| GSE74703 | GAL | 51083 | 6 | 2 | 28 | |
| GSE74704 | GAL | 51083 | 8 | 1 | 11 | |
| TCGA | GAL | 51083 | 43 | 8 | 45 |
Total number of gains: 141; Total number of losses: 43; Total Number of normals: 304.
Somatic mutations of GAL:
Generating mutation plots.
Highly correlated genes for GAL:
Showing top 20/583 corelated genes with mean PCC>0.5.
| Gene1 | Gene2 | Mean PCC | Num. Datasets | Num. PCC<0 | Num. PCC>0.5 |
|---|---|---|---|---|---|
| GAL | HKDC1 | 0.780619 | 3 | 0 | 3 |
| GAL | SPIC | 0.774771 | 3 | 0 | 3 |
| GAL | RAMP1 | 0.755758 | 3 | 0 | 3 |
| GAL | IL3RA | 0.752451 | 3 | 0 | 3 |
| GAL | SAG | 0.751809 | 3 | 0 | 3 |
| GAL | APOBR | 0.740046 | 3 | 0 | 3 |
| GAL | FZR1 | 0.73889 | 3 | 0 | 3 |
| GAL | RBBP7 | 0.729843 | 3 | 0 | 3 |
| GAL | ZBTB10 | 0.728897 | 3 | 0 | 3 |
| GAL | KDM5A | 0.720549 | 3 | 0 | 3 |
| GAL | PMS1 | 0.719244 | 3 | 0 | 3 |
| GAL | PTPN6 | 0.717609 | 3 | 0 | 3 |
| GAL | RIN3 | 0.716307 | 3 | 0 | 3 |
| GAL | RACGAP1 | 0.70439 | 3 | 0 | 3 |
| GAL | TTLL4 | 0.701677 | 3 | 0 | 3 |
| GAL | LRRC58 | 0.696733 | 3 | 0 | 3 |
| GAL | TPCN2 | 0.694458 | 4 | 0 | 4 |
| GAL | FADS1 | 0.693676 | 3 | 0 | 3 |
| GAL | EBF2 | 0.69323 | 3 | 0 | 3 |
| GAL | CRYBB2 | 0.691847 | 4 | 0 | 3 |
For details and further investigation, click here