| Full name: GIT ArfGAP 1 | Alias Symbol: | ||
| Type: protein-coding gene | Cytoband: 17q11.2 | ||
| Entrez ID: 28964 | HGNC ID: HGNC:4272 | Ensembl Gene: ENSG00000108262 | OMIM ID: 608434 |
GIT1 involved pathways:
| KEGG pathway | Description | View |
|---|---|---|
| hsa04810 | Regulation of actin cytoskeleton | |
| hsa05120 | Epithelial cell signaling in Helicobacter pylori infection |
Expression of GIT1:
| Dataset | Gene | EntrezID | Probe | Log2FC | Adj.pValue | Expression |
|---|---|---|---|---|---|---|
| GSE17351 | GIT1 | 28964 | 218030_at | 0.4873 | 0.0579 | |
| GSE20347 | GIT1 | 28964 | 218030_at | 0.4114 | 0.0000 | |
| GSE23400 | GIT1 | 28964 | 218030_at | 0.2037 | 0.0000 | |
| GSE26886 | GIT1 | 28964 | 218030_at | 0.3480 | 0.0073 | |
| GSE29001 | GIT1 | 28964 | 218030_at | 0.0247 | 0.9395 | |
| GSE38129 | GIT1 | 28964 | 218030_at | 0.3456 | 0.0000 | |
| GSE45670 | GIT1 | 28964 | 218030_at | 0.2315 | 0.0235 | |
| GSE53622 | GIT1 | 28964 | 53670 | 0.4641 | 0.0000 | |
| GSE53624 | GIT1 | 28964 | 53670 | 0.5612 | 0.0000 | |
| GSE63941 | GIT1 | 28964 | 218030_at | 0.6454 | 0.0017 | |
| GSE77861 | GIT1 | 28964 | 218030_at | 0.1814 | 0.2159 | |
| GSE97050 | GIT1 | 28964 | A_33_P3401673 | 0.5413 | 0.1242 | |
| SRP007169 | GIT1 | 28964 | RNAseq | 1.4360 | 0.0016 | |
| SRP008496 | GIT1 | 28964 | RNAseq | 1.6066 | 0.0000 | |
| SRP064894 | GIT1 | 28964 | RNAseq | 0.4562 | 0.0137 | |
| SRP133303 | GIT1 | 28964 | RNAseq | 0.3454 | 0.0290 | |
| SRP159526 | GIT1 | 28964 | RNAseq | 0.6814 | 0.0000 | |
| SRP193095 | GIT1 | 28964 | RNAseq | 0.6117 | 0.0000 | |
| SRP219564 | GIT1 | 28964 | RNAseq | 0.2201 | 0.4473 | |
| TCGA | GIT1 | 28964 | RNAseq | 0.1889 | 0.0005 |
Upregulated datasets: 2; Downregulated datasets: 0.
Survival by GIT1 expression:
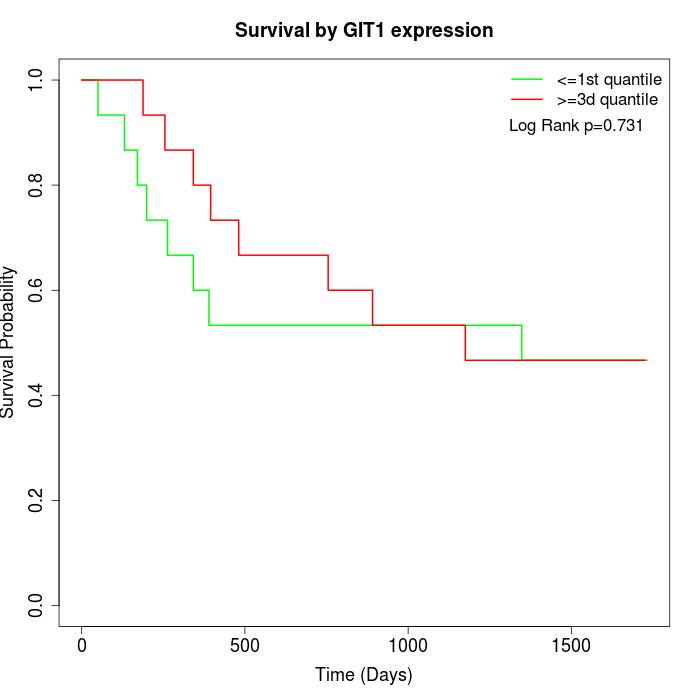 | 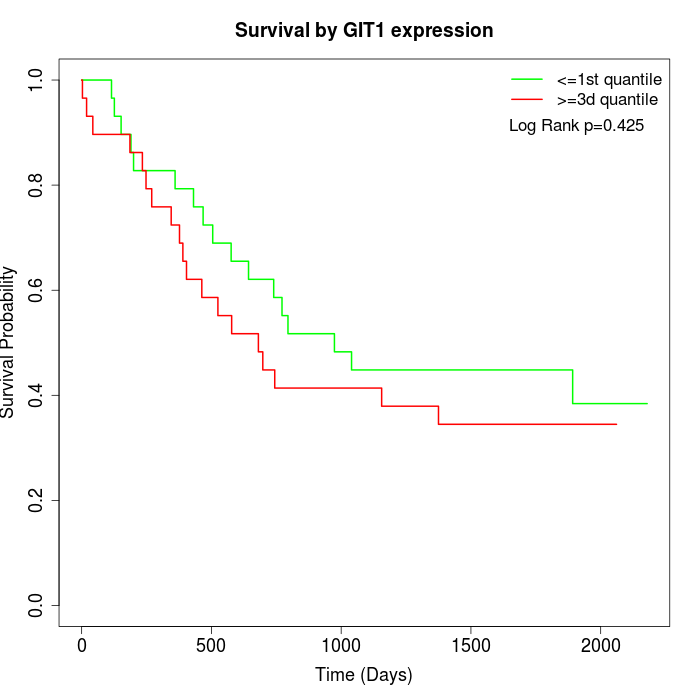 | 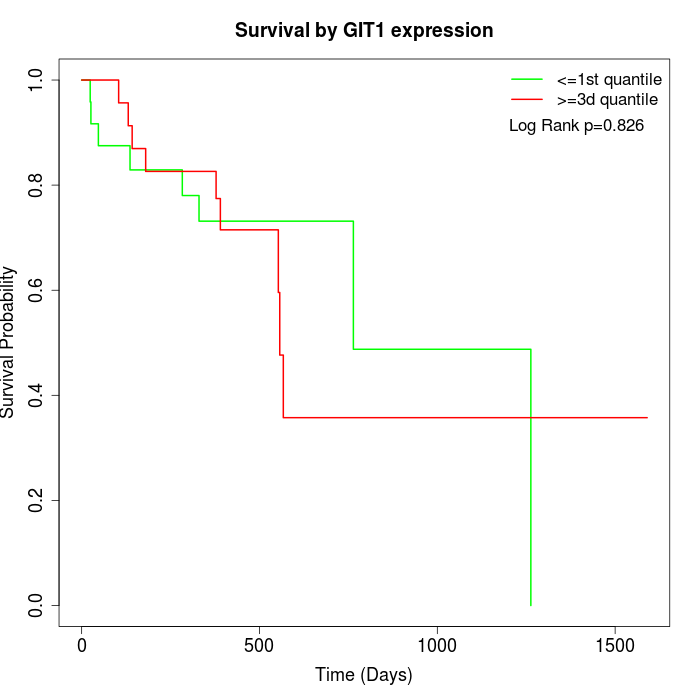 |
| GSE53622 | GSE53624 | TCGA |
Note: Click image to view full size file.
Copy number change of GIT1:
| Dataset | Gene | EntrezID | Gain | Loss | Normal | Detail |
|---|---|---|---|---|---|---|
| GSE15526 | GIT1 | 28964 | 7 | 2 | 21 | |
| GSE20123 | GIT1 | 28964 | 8 | 2 | 20 | |
| GSE43470 | GIT1 | 28964 | 0 | 1 | 42 | |
| GSE46452 | GIT1 | 28964 | 33 | 1 | 25 | |
| GSE47630 | GIT1 | 28964 | 7 | 1 | 32 | |
| GSE54993 | GIT1 | 28964 | 2 | 3 | 65 | |
| GSE54994 | GIT1 | 28964 | 7 | 5 | 41 | |
| GSE60625 | GIT1 | 28964 | 4 | 0 | 7 | |
| GSE74703 | GIT1 | 28964 | 0 | 1 | 35 | |
| GSE74704 | GIT1 | 28964 | 5 | 2 | 13 | |
| TCGA | GIT1 | 28964 | 22 | 9 | 65 |
Total number of gains: 95; Total number of losses: 27; Total Number of normals: 366.
Somatic mutations of GIT1:
Generating mutation plots.
Highly correlated genes for GIT1:
Showing top 20/1255 corelated genes with mean PCC>0.5.
| Gene1 | Gene2 | Mean PCC | Num. Datasets | Num. PCC<0 | Num. PCC>0.5 |
|---|---|---|---|---|---|
| GIT1 | CHRNE | 0.778889 | 3 | 0 | 3 |
| GIT1 | BAK1 | 0.778482 | 3 | 0 | 3 |
| GIT1 | ZBED1 | 0.774607 | 3 | 0 | 3 |
| GIT1 | CXCR5 | 0.767922 | 3 | 0 | 3 |
| GIT1 | CDC14A | 0.766502 | 3 | 0 | 3 |
| GIT1 | C11orf68 | 0.762868 | 3 | 0 | 3 |
| GIT1 | KHNYN | 0.752689 | 3 | 0 | 3 |
| GIT1 | FLYWCH2 | 0.75095 | 3 | 0 | 3 |
| GIT1 | FZR1 | 0.746583 | 6 | 0 | 5 |
| GIT1 | TMPO | 0.743685 | 3 | 0 | 3 |
| GIT1 | RAD18 | 0.742273 | 3 | 0 | 3 |
| GIT1 | GYPA | 0.740249 | 3 | 0 | 3 |
| GIT1 | SAMD4B | 0.739787 | 4 | 0 | 3 |
| GIT1 | LDLRAP1 | 0.739602 | 4 | 0 | 3 |
| GIT1 | CRTC2 | 0.738197 | 5 | 0 | 5 |
| GIT1 | CXCL16 | 0.738166 | 4 | 0 | 4 |
| GIT1 | PCBP3 | 0.732383 | 3 | 0 | 3 |
| GIT1 | TRAPPC1 | 0.731195 | 4 | 0 | 4 |
| GIT1 | ZNF706 | 0.73091 | 3 | 0 | 3 |
| GIT1 | EPN1 | 0.725578 | 6 | 0 | 5 |
For details and further investigation, click here