| Full name: GLI family zinc finger 2 | Alias Symbol: THP2|HPE9|THP1 | ||
| Type: protein-coding gene | Cytoband: 2q14.2 | ||
| Entrez ID: 2736 | HGNC ID: HGNC:4318 | Ensembl Gene: ENSG00000074047 | OMIM ID: 165230 |
GLI2 involved pathways:
| KEGG pathway | Description | View |
|---|---|---|
| hsa04340 | Hedgehog signaling pathway | |
| hsa04390 | Hippo signaling pathway | |
| hsa05200 | Pathways in cancer | |
| hsa05217 | Basal cell carcinoma |
Expression of GLI2:
| Dataset | Gene | EntrezID | Probe | Log2FC | Adj.pValue | Expression |
|---|---|---|---|---|---|---|
| GSE17351 | GLI2 | 2736 | 228537_at | 0.3536 | 0.5473 | |
| GSE20347 | GLI2 | 2736 | 207034_s_at | 1.2641 | 0.0017 | |
| GSE23400 | GLI2 | 2736 | 208057_s_at | -0.1146 | 0.0001 | |
| GSE26886 | GLI2 | 2736 | 228537_at | 1.3055 | 0.0008 | |
| GSE29001 | GLI2 | 2736 | 208057_s_at | -0.1869 | 0.2203 | |
| GSE38129 | GLI2 | 2736 | 207034_s_at | 1.1197 | 0.0002 | |
| GSE45670 | GLI2 | 2736 | 228537_at | 0.5890 | 0.2703 | |
| GSE53622 | GLI2 | 2736 | 97330 | 1.3447 | 0.0000 | |
| GSE53624 | GLI2 | 2736 | 97330 | 1.4559 | 0.0000 | |
| GSE63941 | GLI2 | 2736 | 228537_at | -2.2566 | 0.0016 | |
| GSE77861 | GLI2 | 2736 | 228537_at | 0.4187 | 0.0118 | |
| GSE97050 | GLI2 | 2736 | A_33_P3358469 | 0.0870 | 0.8799 | |
| SRP007169 | GLI2 | 2736 | RNAseq | 7.1711 | 0.0000 | |
| SRP008496 | GLI2 | 2736 | RNAseq | 5.5800 | 0.0000 | |
| SRP064894 | GLI2 | 2736 | RNAseq | 1.0757 | 0.0011 | |
| SRP133303 | GLI2 | 2736 | RNAseq | 1.4041 | 0.0016 | |
| SRP159526 | GLI2 | 2736 | RNAseq | 3.5041 | 0.0000 | |
| SRP193095 | GLI2 | 2736 | RNAseq | 2.6827 | 0.0000 | |
| SRP219564 | GLI2 | 2736 | RNAseq | 1.3570 | 0.1047 | |
| TCGA | GLI2 | 2736 | RNAseq | 0.4185 | 0.0606 |
Upregulated datasets: 11; Downregulated datasets: 1.
Survival by GLI2 expression:
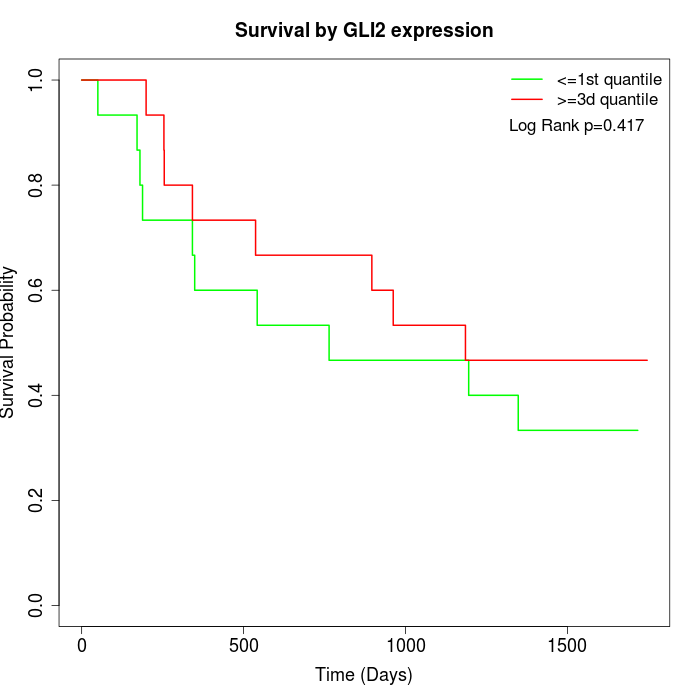 | 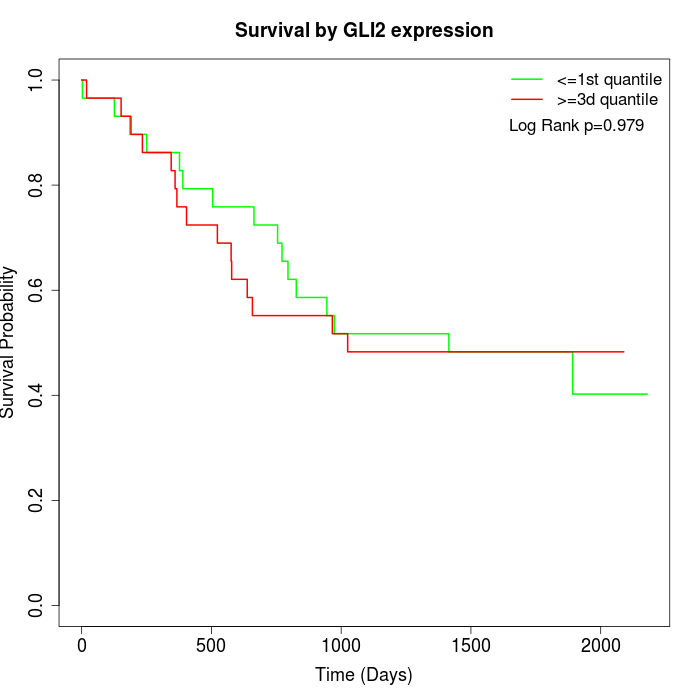 | 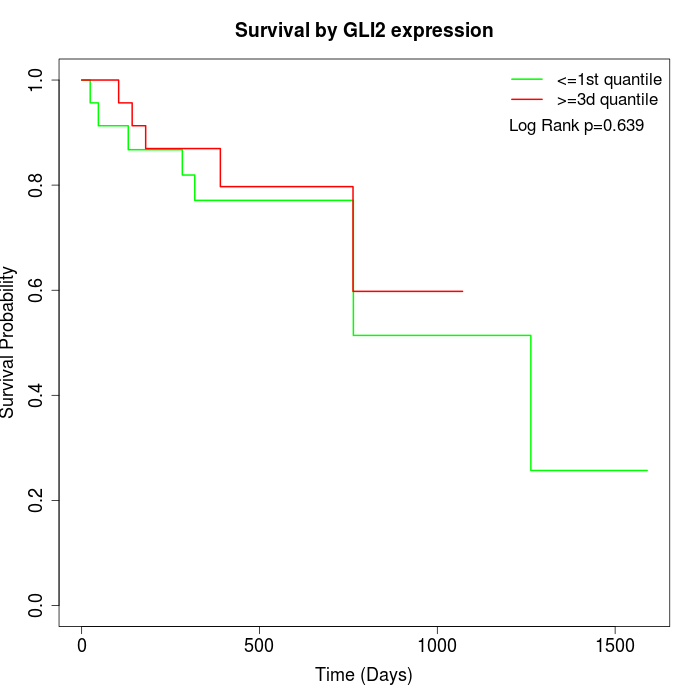 |
| GSE53622 | GSE53624 | TCGA |
Note: Click image to view full size file.
Copy number change of GLI2:
| Dataset | Gene | EntrezID | Gain | Loss | Normal | Detail |
|---|---|---|---|---|---|---|
| GSE15526 | GLI2 | 2736 | 6 | 2 | 22 | |
| GSE20123 | GLI2 | 2736 | 6 | 2 | 22 | |
| GSE43470 | GLI2 | 2736 | 3 | 1 | 39 | |
| GSE46452 | GLI2 | 2736 | 2 | 3 | 54 | |
| GSE47630 | GLI2 | 2736 | 6 | 0 | 34 | |
| GSE54993 | GLI2 | 2736 | 0 | 6 | 64 | |
| GSE54994 | GLI2 | 2736 | 13 | 0 | 40 | |
| GSE60625 | GLI2 | 2736 | 0 | 3 | 8 | |
| GSE74703 | GLI2 | 2736 | 3 | 1 | 32 | |
| GSE74704 | GLI2 | 2736 | 3 | 1 | 16 | |
| TCGA | GLI2 | 2736 | 33 | 5 | 58 |
Total number of gains: 75; Total number of losses: 24; Total Number of normals: 389.
Somatic mutations of GLI2:
Generating mutation plots.
Highly correlated genes for GLI2:
Showing top 20/736 corelated genes with mean PCC>0.5.
| Gene1 | Gene2 | Mean PCC | Num. Datasets | Num. PCC<0 | Num. PCC>0.5 |
|---|---|---|---|---|---|
| GLI2 | C11orf96 | 0.78402 | 3 | 0 | 3 |
| GLI2 | USP12 | 0.77726 | 3 | 0 | 3 |
| GLI2 | IL13RA2 | 0.762331 | 4 | 0 | 4 |
| GLI2 | FAM167B | 0.759518 | 3 | 0 | 3 |
| GLI2 | ZNF423 | 0.754573 | 3 | 0 | 3 |
| GLI2 | DTNA | 0.749379 | 3 | 0 | 3 |
| GLI2 | ITGB3 | 0.749178 | 3 | 0 | 3 |
| GLI2 | S1PR3 | 0.745267 | 4 | 0 | 4 |
| GLI2 | FLNA | 0.743776 | 3 | 0 | 3 |
| GLI2 | TXNRD1 | 0.736381 | 11 | 0 | 10 |
| GLI2 | SH3RF3 | 0.734118 | 4 | 0 | 4 |
| GLI2 | ABCC1 | 0.733413 | 11 | 0 | 11 |
| GLI2 | RILPL1 | 0.732877 | 3 | 0 | 3 |
| GLI2 | SH2B3 | 0.724662 | 4 | 0 | 4 |
| GLI2 | PLA2G4C | 0.724464 | 3 | 0 | 3 |
| GLI2 | HMCN1 | 0.720361 | 3 | 0 | 3 |
| GLI2 | TRIB1 | 0.719036 | 3 | 0 | 3 |
| GLI2 | CRISPLD2 | 0.714852 | 4 | 0 | 4 |
| GLI2 | LIX1L | 0.708291 | 3 | 0 | 3 |
| GLI2 | CCDC136 | 0.705208 | 3 | 0 | 3 |
For details and further investigation, click here