| Full name: glycosyltransferase 8 domain containing 2 | Alias Symbol: FLJ31494 | ||
| Type: protein-coding gene | Cytoband: 12q23.3 | ||
| Entrez ID: 83468 | HGNC ID: HGNC:24890 | Ensembl Gene: ENSG00000120820 | OMIM ID: |
| Drug and gene relationship at DGIdb | |||
Expression of GLT8D2:
| Dataset | Gene | EntrezID | Probe | Log2FC | Adj.pValue | Expression |
|---|---|---|---|---|---|---|
| GSE17351 | GLT8D2 | 83468 | 227070_at | -0.1736 | 0.8600 | |
| GSE20347 | GLT8D2 | 83468 | 221447_s_at | 0.2544 | 0.0540 | |
| GSE23400 | GLT8D2 | 83468 | 221447_s_at | 0.0649 | 0.4130 | |
| GSE26886 | GLT8D2 | 83468 | 221447_s_at | 0.2213 | 0.2752 | |
| GSE29001 | GLT8D2 | 83468 | 221447_s_at | 0.1325 | 0.5324 | |
| GSE38129 | GLT8D2 | 83468 | 221447_s_at | 0.0277 | 0.9167 | |
| GSE45670 | GLT8D2 | 83468 | 227070_at | -1.4278 | 0.0446 | |
| GSE53622 | GLT8D2 | 83468 | 88743 | 0.8809 | 0.0000 | |
| GSE53624 | GLT8D2 | 83468 | 88743 | 1.2290 | 0.0000 | |
| GSE63941 | GLT8D2 | 83468 | 221447_s_at | -3.7241 | 0.0001 | |
| GSE77861 | GLT8D2 | 83468 | 221447_s_at | -0.1606 | 0.2592 | |
| GSE97050 | GLT8D2 | 83468 | A_23_P48198 | 0.4578 | 0.3692 | |
| SRP007169 | GLT8D2 | 83468 | RNAseq | 2.9915 | 0.0000 | |
| SRP008496 | GLT8D2 | 83468 | RNAseq | 3.6674 | 0.0000 | |
| SRP064894 | GLT8D2 | 83468 | RNAseq | 1.1668 | 0.0001 | |
| SRP133303 | GLT8D2 | 83468 | RNAseq | 1.1348 | 0.0026 | |
| SRP159526 | GLT8D2 | 83468 | RNAseq | 0.1376 | 0.6272 | |
| SRP193095 | GLT8D2 | 83468 | RNAseq | 1.7909 | 0.0000 | |
| SRP219564 | GLT8D2 | 83468 | RNAseq | 0.8140 | 0.2398 | |
| TCGA | GLT8D2 | 83468 | RNAseq | 0.0253 | 0.8799 |
Upregulated datasets: 6; Downregulated datasets: 2.
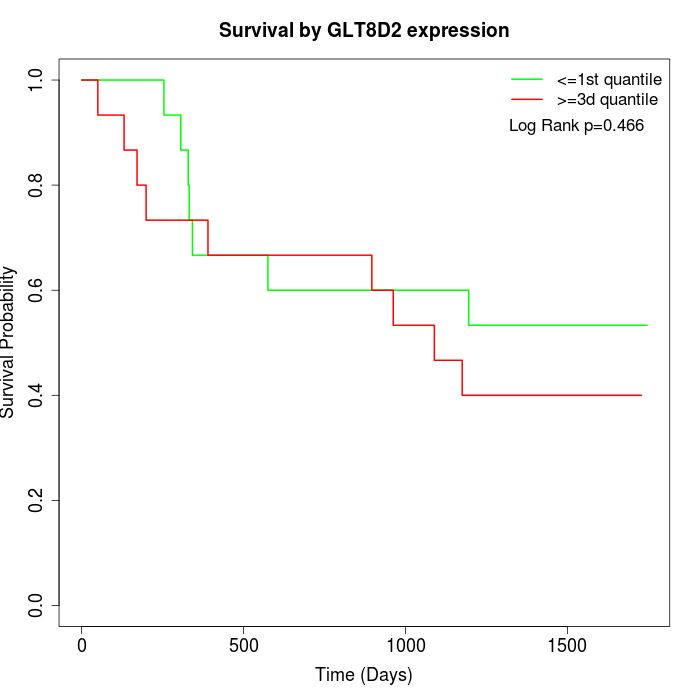
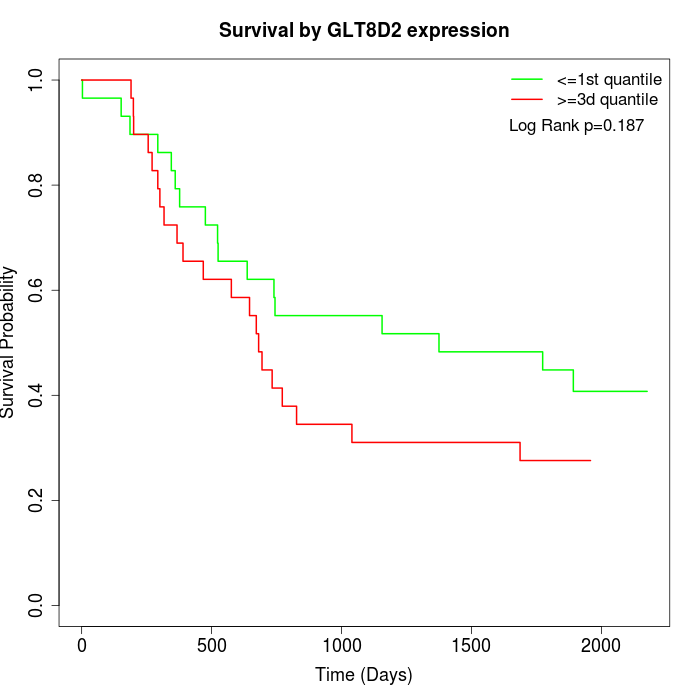
Survival by GLT8D2 expression:
Note: Click image to view full size file.
Copy number change of GLT8D2:
| Dataset | Gene | EntrezID | Gain | Loss | Normal | Detail |
|---|---|---|---|---|---|---|
| GSE15526 | GLT8D2 | 83468 | 4 | 2 | 24 | |
| GSE20123 | GLT8D2 | 83468 | 4 | 2 | 24 | |
| GSE43470 | GLT8D2 | 83468 | 2 | 0 | 41 | |
| GSE46452 | GLT8D2 | 83468 | 9 | 1 | 49 | |
| GSE47630 | GLT8D2 | 83468 | 9 | 1 | 30 | |
| GSE54993 | GLT8D2 | 83468 | 0 | 5 | 65 | |
| GSE54994 | GLT8D2 | 83468 | 4 | 2 | 47 | |
| GSE60625 | GLT8D2 | 83468 | 0 | 0 | 11 | |
| GSE74703 | GLT8D2 | 83468 | 2 | 0 | 34 | |
| GSE74704 | GLT8D2 | 83468 | 1 | 2 | 17 | |
| TCGA | GLT8D2 | 83468 | 19 | 11 | 66 |
Total number of gains: 54; Total number of losses: 26; Total Number of normals: 408.
Somatic mutations of GLT8D2:
Generating mutation plots.
Highly correlated genes for GLT8D2:
Showing top 20/911 corelated genes with mean PCC>0.5.
| Gene1 | Gene2 | Mean PCC | Num. Datasets | Num. PCC<0 | Num. PCC>0.5 |
|---|---|---|---|---|---|
| GLT8D2 | SGTB | 0.786667 | 4 | 0 | 4 |
| GLT8D2 | FKBP7 | 0.763155 | 6 | 0 | 6 |
| GLT8D2 | LRRC8C | 0.74935 | 3 | 0 | 3 |
| GLT8D2 | GDF6 | 0.748483 | 3 | 0 | 3 |
| GLT8D2 | DPP4 | 0.744802 | 5 | 0 | 5 |
| GLT8D2 | BICC1 | 0.74438 | 10 | 0 | 9 |
| GLT8D2 | FCGR3A | 0.743229 | 3 | 0 | 3 |
| GLT8D2 | LYSMD3 | 0.73762 | 3 | 0 | 3 |
| GLT8D2 | IGDCC4 | 0.736913 | 8 | 0 | 7 |
| GLT8D2 | SPON2 | 0.735938 | 4 | 0 | 4 |
| GLT8D2 | COL6A1 | 0.735229 | 12 | 0 | 12 |
| GLT8D2 | C20orf194 | 0.731649 | 3 | 0 | 3 |
| GLT8D2 | CLMP | 0.730733 | 7 | 0 | 6 |
| GLT8D2 | ITGA11 | 0.726112 | 4 | 0 | 4 |
| GLT8D2 | FSTL1 | 0.721388 | 12 | 0 | 11 |
| GLT8D2 | SLC39A1 | 0.720001 | 3 | 0 | 3 |
| GLT8D2 | SEC22C | 0.718663 | 6 | 0 | 6 |
| GLT8D2 | CHN1 | 0.718184 | 12 | 0 | 11 |
| GLT8D2 | PDGFRL | 0.711553 | 11 | 0 | 9 |
| GLT8D2 | ISLR | 0.709395 | 11 | 0 | 10 |
For details and further investigation, click here


