| Full name: golgi transport 1B | Alias Symbol: CGI-141|YMR292W|GOT1 | ||
| Type: protein-coding gene | Cytoband: 12p12.1 | ||
| Entrez ID: 51026 | HGNC ID: HGNC:20175 | Ensembl Gene: ENSG00000111711 | OMIM ID: 615078 |
Screen Evidence:
| |||
Expression of GOLT1B:
| Dataset | Gene | EntrezID | Probe | Log2FC | Adj.pValue | Expression |
|---|---|---|---|---|---|---|
| GSE17351 | GOLT1B | 51026 | 222552_at | 0.1968 | 0.6496 | |
| GSE20347 | GOLT1B | 51026 | 218193_s_at | 0.7786 | 0.0069 | |
| GSE23400 | GOLT1B | 51026 | 218193_s_at | 0.8126 | 0.0000 | |
| GSE26886 | GOLT1B | 51026 | 222552_at | 0.0089 | 0.9786 | |
| GSE29001 | GOLT1B | 51026 | 218193_s_at | 0.5824 | 0.1287 | |
| GSE38129 | GOLT1B | 51026 | 218193_s_at | 0.9050 | 0.0005 | |
| GSE45670 | GOLT1B | 51026 | 222552_at | 0.4047 | 0.0098 | |
| GSE53622 | GOLT1B | 51026 | 8810 | 0.4956 | 0.0000 | |
| GSE53624 | GOLT1B | 51026 | 86279 | 0.5470 | 0.0000 | |
| GSE63941 | GOLT1B | 51026 | 222552_at | -0.9785 | 0.0507 | |
| GSE77861 | GOLT1B | 51026 | 222552_at | 0.6282 | 0.0673 | |
| GSE97050 | GOLT1B | 51026 | A_24_P321511 | 0.5595 | 0.1857 | |
| SRP007169 | GOLT1B | 51026 | RNAseq | 0.6217 | 0.0966 | |
| SRP008496 | GOLT1B | 51026 | RNAseq | 1.1632 | 0.0015 | |
| SRP064894 | GOLT1B | 51026 | RNAseq | 0.6357 | 0.0010 | |
| SRP133303 | GOLT1B | 51026 | RNAseq | 1.1991 | 0.0000 | |
| SRP159526 | GOLT1B | 51026 | RNAseq | 0.2945 | 0.1454 | |
| SRP193095 | GOLT1B | 51026 | RNAseq | 0.2864 | 0.0250 | |
| SRP219564 | GOLT1B | 51026 | RNAseq | 0.5041 | 0.1661 | |
| TCGA | GOLT1B | 51026 | RNAseq | 0.1495 | 0.0032 |
Upregulated datasets: 2; Downregulated datasets: 0.
Survival by GOLT1B expression:
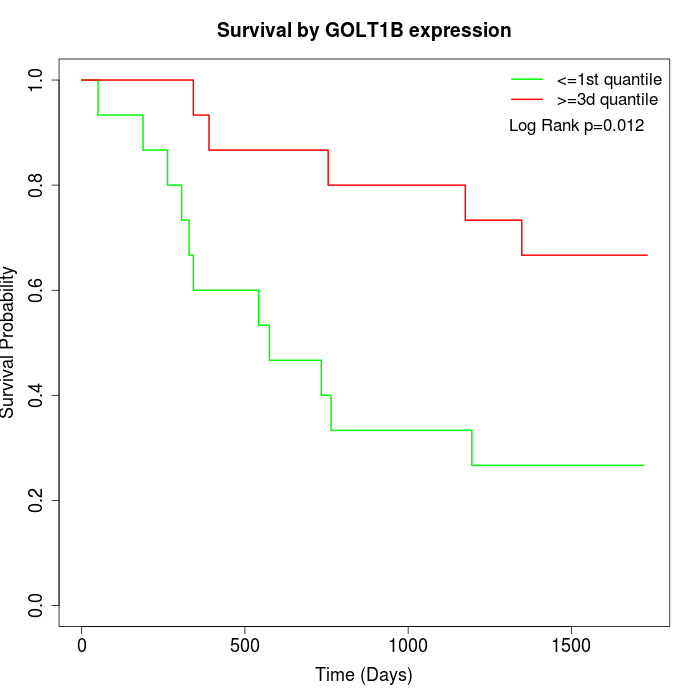 | 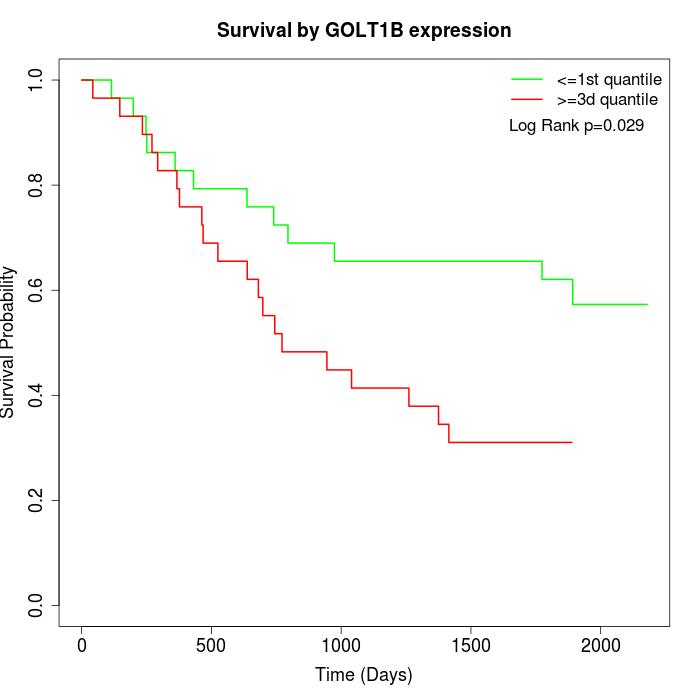 | 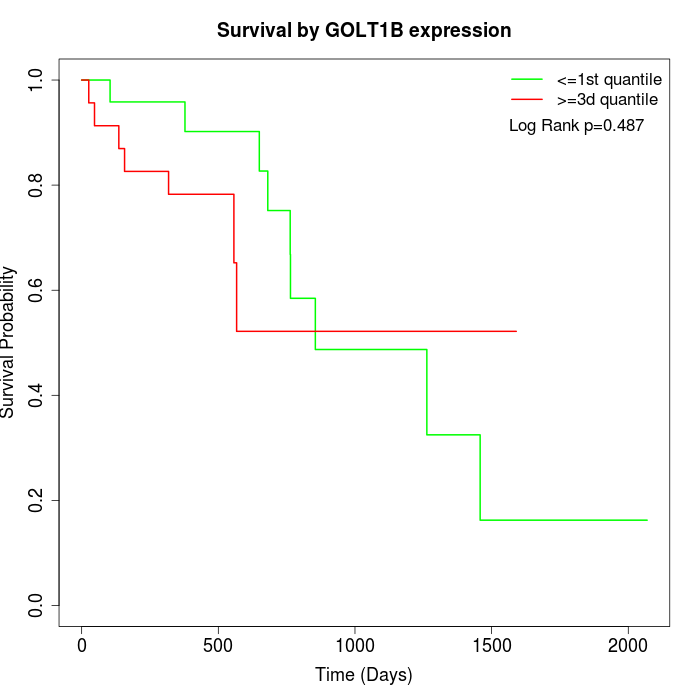 |
| GSE53622 | GSE53624 | TCGA |
Note: Click image to view full size file.
Copy number change of GOLT1B:
| Dataset | Gene | EntrezID | Gain | Loss | Normal | Detail |
|---|---|---|---|---|---|---|
| GSE15526 | GOLT1B | 51026 | 9 | 2 | 19 | |
| GSE20123 | GOLT1B | 51026 | 9 | 2 | 19 | |
| GSE43470 | GOLT1B | 51026 | 9 | 4 | 30 | |
| GSE46452 | GOLT1B | 51026 | 10 | 1 | 48 | |
| GSE47630 | GOLT1B | 51026 | 14 | 1 | 25 | |
| GSE54993 | GOLT1B | 51026 | 1 | 9 | 60 | |
| GSE54994 | GOLT1B | 51026 | 11 | 2 | 40 | |
| GSE60625 | GOLT1B | 51026 | 0 | 1 | 10 | |
| GSE74703 | GOLT1B | 51026 | 9 | 3 | 24 | |
| GSE74704 | GOLT1B | 51026 | 6 | 1 | 13 | |
| TCGA | GOLT1B | 51026 | 42 | 5 | 49 |
Total number of gains: 120; Total number of losses: 31; Total Number of normals: 337.
Somatic mutations of GOLT1B:
Generating mutation plots.
Highly correlated genes for GOLT1B:
Showing top 20/1127 corelated genes with mean PCC>0.5.
| Gene1 | Gene2 | Mean PCC | Num. Datasets | Num. PCC<0 | Num. PCC>0.5 |
|---|---|---|---|---|---|
| GOLT1B | SETX | 0.768589 | 3 | 0 | 3 |
| GOLT1B | TRAF7 | 0.7369 | 3 | 0 | 3 |
| GOLT1B | FMR1 | 0.707673 | 4 | 0 | 4 |
| GOLT1B | TAS2R19 | 0.705189 | 3 | 0 | 3 |
| GOLT1B | PYCR2 | 0.70316 | 3 | 0 | 3 |
| GOLT1B | SLC30A7 | 0.701196 | 4 | 0 | 4 |
| GOLT1B | HSD17B6 | 0.701163 | 3 | 0 | 3 |
| GOLT1B | AGTPBP1 | 0.700298 | 3 | 0 | 3 |
| GOLT1B | RNMT | 0.700171 | 4 | 0 | 3 |
| GOLT1B | CDK5 | 0.694858 | 5 | 0 | 5 |
| GOLT1B | TMEM209 | 0.692459 | 7 | 0 | 7 |
| GOLT1B | CMTM6 | 0.692227 | 4 | 0 | 3 |
| GOLT1B | STRAP | 0.692087 | 13 | 0 | 12 |
| GOLT1B | LRRC58 | 0.684641 | 3 | 0 | 3 |
| GOLT1B | SAAL1 | 0.682164 | 5 | 0 | 5 |
| GOLT1B | C8orf76 | 0.678089 | 4 | 0 | 3 |
| GOLT1B | LRRC8C | 0.677611 | 3 | 0 | 3 |
| GOLT1B | VPS35 | 0.674088 | 4 | 0 | 4 |
| GOLT1B | YIF1A | 0.674087 | 8 | 0 | 8 |
| GOLT1B | ANAPC1 | 0.671339 | 3 | 0 | 3 |
For details and further investigation, click here