| Full name: G protein-coupled receptor 18 | Alias Symbol: | ||
| Type: protein-coding gene | Cytoband: 13q32.3 | ||
| Entrez ID: 2841 | HGNC ID: HGNC:4472 | Ensembl Gene: ENSG00000125245 | OMIM ID: 602042 |
| Related drugs: ANANDAMIDE, ARACHIDONOYL GLYCINE, CANNABIDIOL, CHEMBL285932, CHEMBL418353... [more] | |||
Expression of GPR18:
| Dataset | Gene | EntrezID | Probe | Log2FC | Adj.pValue | Expression |
|---|---|---|---|---|---|---|
| GSE17351 | GPR18 | 2841 | 210279_at | 0.3324 | 0.7485 | |
| GSE20347 | GPR18 | 2841 | 210279_at | -0.1264 | 0.2158 | |
| GSE23400 | GPR18 | 2841 | 210279_at | -0.0200 | 0.4776 | |
| GSE26886 | GPR18 | 2841 | 210279_at | -0.6972 | 0.0632 | |
| GSE29001 | GPR18 | 2841 | 210279_at | -0.1265 | 0.6204 | |
| GSE38129 | GPR18 | 2841 | 210279_at | -0.1997 | 0.2748 | |
| GSE45670 | GPR18 | 2841 | 210279_at | 0.0314 | 0.9353 | |
| GSE53622 | GPR18 | 2841 | 80345 | -0.6084 | 0.0001 | |
| GSE53624 | GPR18 | 2841 | 80345 | -0.8975 | 0.0000 | |
| GSE63941 | GPR18 | 2841 | 210279_at | 0.3278 | 0.1462 | |
| GSE77861 | GPR18 | 2841 | 210279_at | -0.0191 | 0.8654 | |
| GSE97050 | GPR18 | 2841 | A_23_P14165 | 0.1657 | 0.6701 | |
| SRP133303 | GPR18 | 2841 | RNAseq | -0.7522 | 0.0000 | |
| SRP193095 | GPR18 | 2841 | RNAseq | -0.5768 | 0.0008 | |
| TCGA | GPR18 | 2841 | RNAseq | 0.0716 | 0.8169 |
Upregulated datasets: 0; Downregulated datasets: 0.
Survival by GPR18 expression:
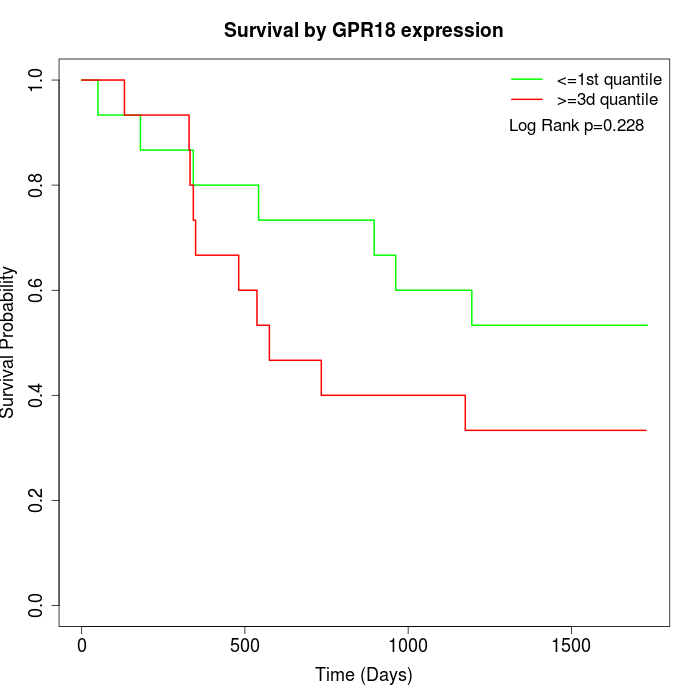 | 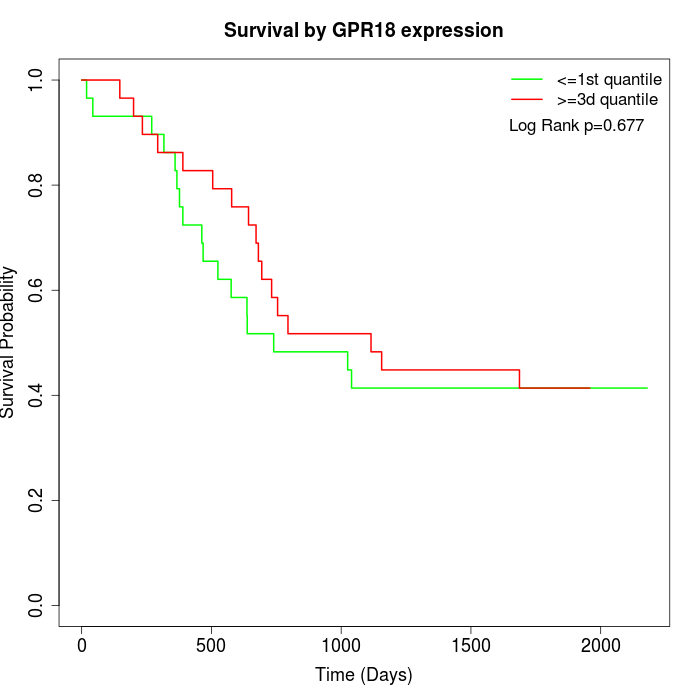 | 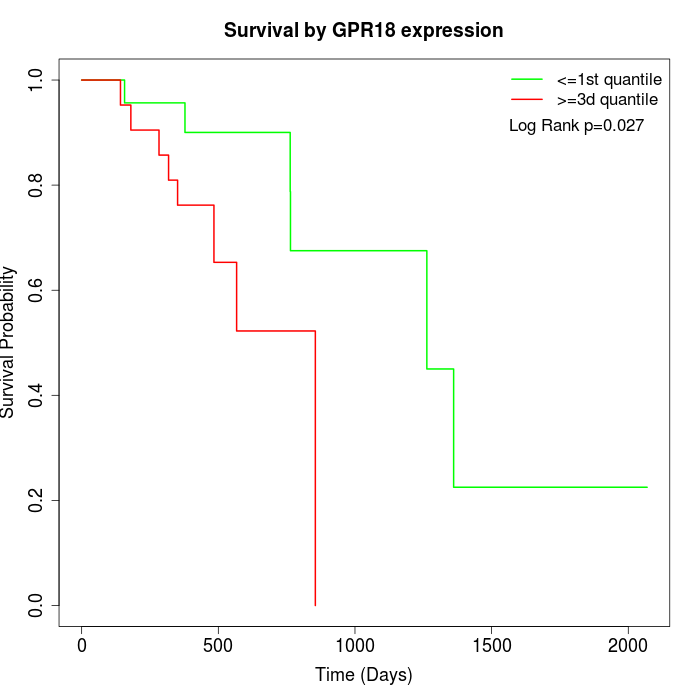 |
| GSE53622 | GSE53624 | TCGA |
Note: Click image to view full size file.
Copy number change of GPR18:
| Dataset | Gene | EntrezID | Gain | Loss | Normal | Detail |
|---|---|---|---|---|---|---|
| GSE15526 | GPR18 | 2841 | 3 | 8 | 19 | |
| GSE20123 | GPR18 | 2841 | 3 | 8 | 19 | |
| GSE43470 | GPR18 | 2841 | 4 | 12 | 27 | |
| GSE46452 | GPR18 | 2841 | 0 | 32 | 27 | |
| GSE47630 | GPR18 | 2841 | 3 | 26 | 11 | |
| GSE54993 | GPR18 | 2841 | 11 | 4 | 55 | |
| GSE54994 | GPR18 | 2841 | 4 | 10 | 39 | |
| GSE60625 | GPR18 | 2841 | 0 | 3 | 8 | |
| GSE74703 | GPR18 | 2841 | 3 | 10 | 23 | |
| GSE74704 | GPR18 | 2841 | 1 | 7 | 12 | |
| TCGA | GPR18 | 2841 | 14 | 34 | 48 |
Total number of gains: 46; Total number of losses: 154; Total Number of normals: 288.
Somatic mutations of GPR18:
Generating mutation plots.
Highly correlated genes for GPR18:
Showing top 20/254 corelated genes with mean PCC>0.5.
| Gene1 | Gene2 | Mean PCC | Num. Datasets | Num. PCC<0 | Num. PCC>0.5 |
|---|---|---|---|---|---|
| GPR18 | BTLA | 0.772913 | 6 | 0 | 6 |
| GPR18 | LINC01215 | 0.733134 | 5 | 0 | 5 |
| GPR18 | ARHGAP15 | 0.714575 | 3 | 0 | 3 |
| GPR18 | ITK | 0.704897 | 10 | 0 | 9 |
| GPR18 | GAPT | 0.702826 | 7 | 0 | 7 |
| GPR18 | TAGAP | 0.695576 | 5 | 0 | 5 |
| GPR18 | PPP1R16B | 0.695488 | 8 | 0 | 8 |
| GPR18 | TRAT1 | 0.69258 | 9 | 0 | 7 |
| GPR18 | GPR174 | 0.687571 | 3 | 0 | 3 |
| GPR18 | CD37 | 0.687107 | 8 | 0 | 7 |
| GPR18 | FCRL3 | 0.686981 | 7 | 0 | 6 |
| GPR18 | CD2 | 0.684533 | 10 | 0 | 9 |
| GPR18 | GIMAP5 | 0.682419 | 3 | 0 | 3 |
| GPR18 | CORO1A | 0.681154 | 10 | 0 | 8 |
| GPR18 | FCRLA | 0.680135 | 6 | 0 | 5 |
| GPR18 | C16orf54 | 0.678661 | 6 | 0 | 6 |
| GPR18 | SH3BP2 | 0.67771 | 3 | 0 | 3 |
| GPR18 | MSI2 | 0.677147 | 3 | 0 | 3 |
| GPR18 | CD48 | 0.676092 | 10 | 0 | 9 |
| GPR18 | IFIH1 | 0.674299 | 3 | 0 | 3 |
For details and further investigation, click here