| Full name: glutamate ionotropic receptor AMPA type subunit 1 | Alias Symbol: GluA1|GLURA | ||
| Type: protein-coding gene | Cytoband: 5q33.2 | ||
| Entrez ID: 2890 | HGNC ID: HGNC:4571 | Ensembl Gene: ENSG00000155511 | OMIM ID: 138248 |
| Related drugs: (R,S)-AMPA, ANIRACETAM, BECAMPANEL, CHEMBL1097939, CHEMBL123132, CHEMBL1255648, CHEMBL136800, CHEMBL222418, CHEMBL265301, CHEMBL320642... [more] | |||
GRIA1 involved pathways:
Expression of GRIA1:
| Dataset | Gene | EntrezID | Probe | Log2FC | Adj.pValue | Expression |
|---|---|---|---|---|---|---|
| GSE17351 | GRIA1 | 2890 | 209793_at | -0.3263 | 0.3506 | |
| GSE20347 | GRIA1 | 2890 | 209793_at | 0.0571 | 0.3559 | |
| GSE23400 | GRIA1 | 2890 | 209793_at | -0.0248 | 0.3555 | |
| GSE26886 | GRIA1 | 2890 | 209793_at | 0.0636 | 0.4906 | |
| GSE29001 | GRIA1 | 2890 | 209793_at | -0.2583 | 0.0593 | |
| GSE38129 | GRIA1 | 2890 | 209793_at | 0.0314 | 0.8645 | |
| GSE45670 | GRIA1 | 2890 | 209793_at | -0.2793 | 0.0366 | |
| GSE53622 | GRIA1 | 2890 | 98016 | -0.4275 | 0.0263 | |
| GSE53624 | GRIA1 | 2890 | 98016 | -0.0015 | 0.9927 | |
| GSE63941 | GRIA1 | 2890 | 209793_at | -0.1714 | 0.3684 | |
| GSE77861 | GRIA1 | 2890 | 211520_s_at | -0.0266 | 0.8068 | |
| GSE97050 | GRIA1 | 2890 | A_23_P303072 | -0.3726 | 0.4850 | |
| TCGA | GRIA1 | 2890 | RNAseq | -2.4193 | 0.0002 |
Upregulated datasets: 0; Downregulated datasets: 1.
Survival by GRIA1 expression:
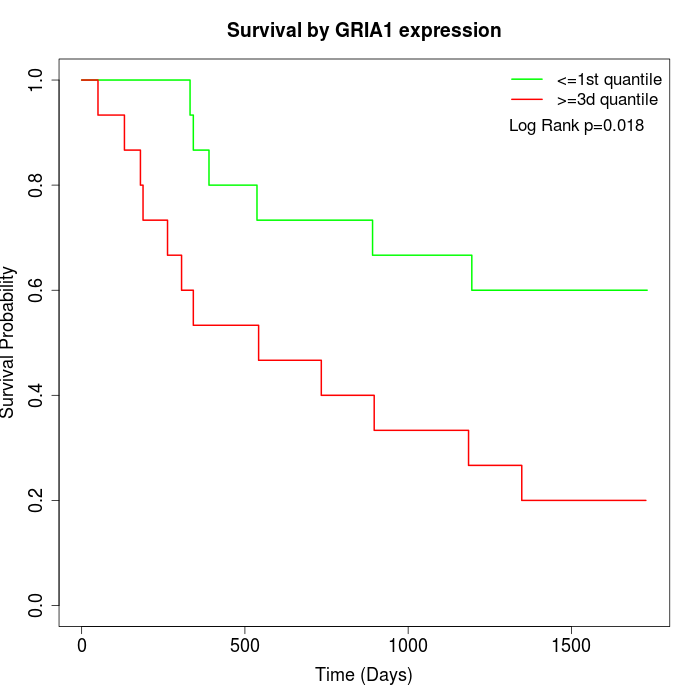 | 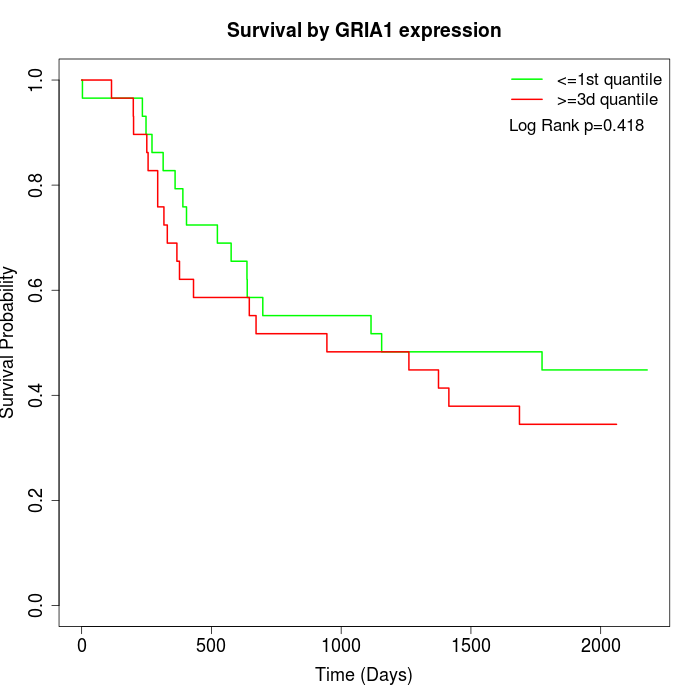 | 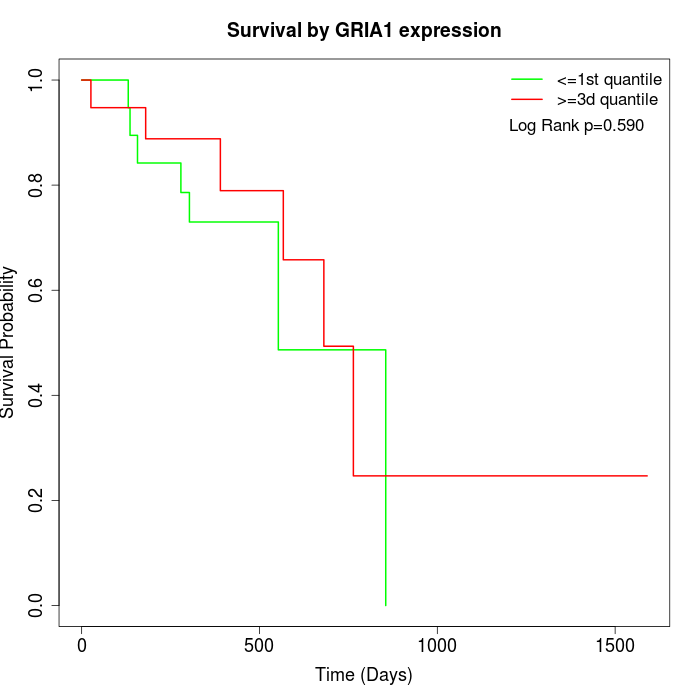 |
| GSE53622 | GSE53624 | TCGA |
Note: Click image to view full size file.
Copy number change of GRIA1:
| Dataset | Gene | EntrezID | Gain | Loss | Normal | Detail |
|---|---|---|---|---|---|---|
| GSE15526 | GRIA1 | 2890 | 0 | 12 | 18 | |
| GSE20123 | GRIA1 | 2890 | 1 | 12 | 17 | |
| GSE43470 | GRIA1 | 2890 | 2 | 10 | 31 | |
| GSE46452 | GRIA1 | 2890 | 0 | 27 | 32 | |
| GSE47630 | GRIA1 | 2890 | 0 | 20 | 20 | |
| GSE54993 | GRIA1 | 2890 | 9 | 1 | 60 | |
| GSE54994 | GRIA1 | 2890 | 1 | 16 | 36 | |
| GSE60625 | GRIA1 | 2890 | 0 | 0 | 11 | |
| GSE74703 | GRIA1 | 2890 | 2 | 8 | 26 | |
| GSE74704 | GRIA1 | 2890 | 1 | 7 | 12 | |
| TCGA | GRIA1 | 2890 | 5 | 37 | 54 |
Total number of gains: 21; Total number of losses: 150; Total Number of normals: 317.
Somatic mutations of GRIA1:
Generating mutation plots.
Highly correlated genes for GRIA1:
Showing top 20/291 corelated genes with mean PCC>0.5.
| Gene1 | Gene2 | Mean PCC | Num. Datasets | Num. PCC<0 | Num. PCC>0.5 |
|---|---|---|---|---|---|
| GRIA1 | SLC35F1 | 0.747108 | 3 | 0 | 3 |
| GRIA1 | NRK | 0.720674 | 3 | 0 | 3 |
| GRIA1 | F10 | 0.714103 | 4 | 0 | 4 |
| GRIA1 | GALR1 | 0.712152 | 3 | 0 | 3 |
| GRIA1 | FGF16 | 0.704246 | 3 | 0 | 3 |
| GRIA1 | RIC3 | 0.699271 | 3 | 0 | 3 |
| GRIA1 | SCG3 | 0.691805 | 4 | 0 | 3 |
| GRIA1 | ANGPTL7 | 0.685169 | 4 | 0 | 4 |
| GRIA1 | SOX3 | 0.67821 | 3 | 0 | 3 |
| GRIA1 | TMEM8B | 0.673042 | 4 | 0 | 3 |
| GRIA1 | KCNC1 | 0.668186 | 3 | 0 | 3 |
| GRIA1 | CASQ1 | 0.666342 | 4 | 0 | 3 |
| GRIA1 | MTTP | 0.666324 | 4 | 0 | 3 |
| GRIA1 | CAMK2A | 0.666062 | 5 | 0 | 3 |
| GRIA1 | CDH2 | 0.663092 | 3 | 0 | 3 |
| GRIA1 | ZNF660 | 0.662644 | 4 | 0 | 4 |
| GRIA1 | PRKACG | 0.661969 | 4 | 0 | 3 |
| GRIA1 | ABCA9 | 0.661446 | 4 | 0 | 4 |
| GRIA1 | CLDN6 | 0.660557 | 3 | 0 | 3 |
| GRIA1 | EPO | 0.659776 | 4 | 0 | 4 |
For details and further investigation, click here