| Full name: calsequestrin 1 | Alias Symbol: PDIB1 | ||
| Type: protein-coding gene | Cytoband: 1q23.2 | ||
| Entrez ID: 844 | HGNC ID: HGNC:1512 | Ensembl Gene: ENSG00000143318 | OMIM ID: 114250 |
| Drug and gene relationship at DGIdb | |||
Expression of CASQ1:
| Dataset | Gene | EntrezID | Probe | Log2FC | Adj.pValue | Expression |
|---|---|---|---|---|---|---|
| GSE17351 | CASQ1 | 844 | 219645_at | -0.4187 | 0.5377 | |
| GSE20347 | CASQ1 | 844 | 219645_at | -0.1120 | 0.1026 | |
| GSE23400 | CASQ1 | 844 | 219645_at | -0.0942 | 0.0153 | |
| GSE26886 | CASQ1 | 844 | 219645_at | -0.0830 | 0.3250 | |
| GSE29001 | CASQ1 | 844 | 219645_at | -0.0753 | 0.7937 | |
| GSE38129 | CASQ1 | 844 | 219645_at | -0.3418 | 0.0107 | |
| GSE45670 | CASQ1 | 844 | 219645_at | -0.1829 | 0.0225 | |
| GSE53622 | CASQ1 | 844 | 100467 | -1.0122 | 0.0000 | |
| GSE53624 | CASQ1 | 844 | 100467 | -1.0017 | 0.0000 | |
| GSE63941 | CASQ1 | 844 | 219645_at | 0.0754 | 0.5792 | |
| GSE77861 | CASQ1 | 844 | 219645_at | -0.0300 | 0.7459 | |
| GSE97050 | CASQ1 | 844 | A_23_P173 | -0.9118 | 0.1695 | |
| SRP159526 | CASQ1 | 844 | RNAseq | -0.2034 | 0.7968 | |
| SRP219564 | CASQ1 | 844 | RNAseq | -1.5728 | 0.2051 | |
| TCGA | CASQ1 | 844 | RNAseq | -1.6578 | 0.0028 |
Upregulated datasets: 0; Downregulated datasets: 3.
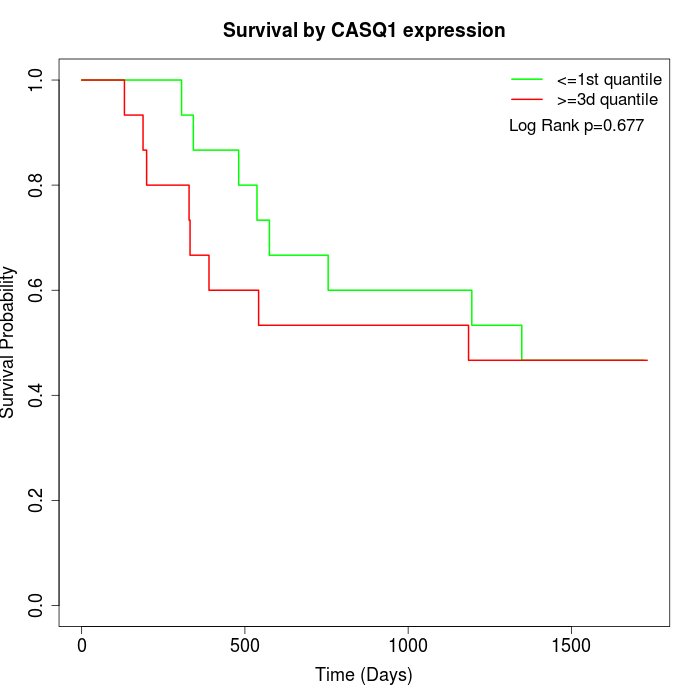
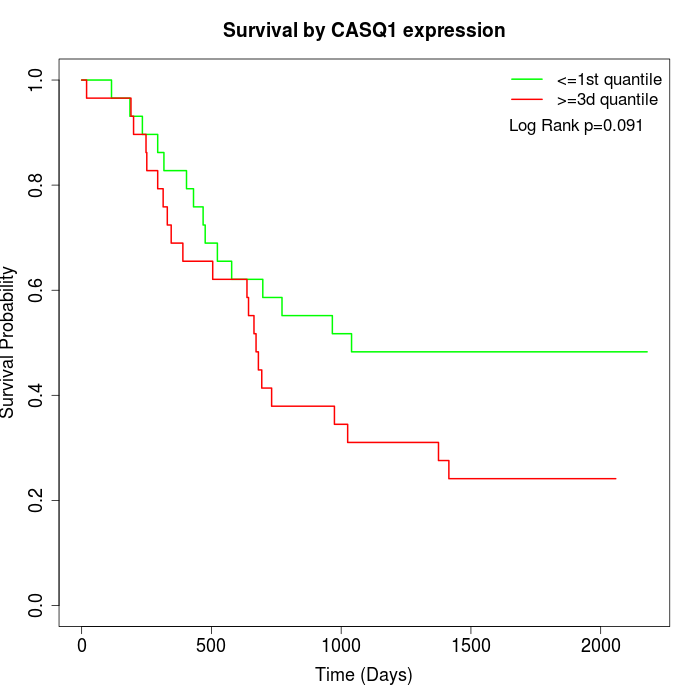
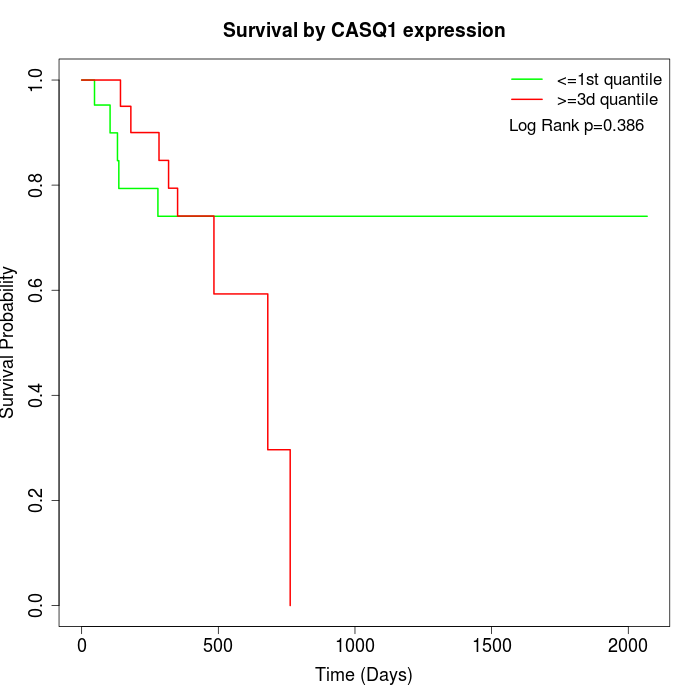
Survival by CASQ1 expression:
Note: Click image to view full size file.
Copy number change of CASQ1:
| Dataset | Gene | EntrezID | Gain | Loss | Normal | Detail |
|---|---|---|---|---|---|---|
| GSE15526 | CASQ1 | 844 | 10 | 0 | 20 | |
| GSE20123 | CASQ1 | 844 | 10 | 0 | 20 | |
| GSE43470 | CASQ1 | 844 | 7 | 2 | 34 | |
| GSE46452 | CASQ1 | 844 | 2 | 1 | 56 | |
| GSE47630 | CASQ1 | 844 | 15 | 0 | 25 | |
| GSE54993 | CASQ1 | 844 | 0 | 5 | 65 | |
| GSE54994 | CASQ1 | 844 | 16 | 0 | 37 | |
| GSE60625 | CASQ1 | 844 | 0 | 0 | 11 | |
| GSE74703 | CASQ1 | 844 | 7 | 2 | 27 | |
| GSE74704 | CASQ1 | 844 | 4 | 0 | 16 | |
| TCGA | CASQ1 | 844 | 44 | 3 | 49 |
Total number of gains: 115; Total number of losses: 13; Total Number of normals: 360.
Somatic mutations of CASQ1:
Generating mutation plots.
Highly correlated genes for CASQ1:
Showing top 20/600 corelated genes with mean PCC>0.5.
| Gene1 | Gene2 | Mean PCC | Num. Datasets | Num. PCC<0 | Num. PCC>0.5 |
|---|---|---|---|---|---|
| CASQ1 | PPP1R14A | 0.799814 | 4 | 0 | 4 |
| CASQ1 | GIPC3 | 0.788576 | 3 | 0 | 3 |
| CASQ1 | IQUB | 0.767366 | 3 | 0 | 3 |
| CASQ1 | MBNL1-AS1 | 0.767089 | 3 | 0 | 3 |
| CASQ1 | MORN5 | 0.765769 | 3 | 0 | 3 |
| CASQ1 | KITLG | 0.764526 | 3 | 0 | 3 |
| CASQ1 | RBFOX3 | 0.759698 | 3 | 0 | 3 |
| CASQ1 | OPRM1 | 0.751778 | 3 | 0 | 3 |
| CASQ1 | SORCS1 | 0.747876 | 4 | 0 | 4 |
| CASQ1 | SYNC | 0.735678 | 4 | 0 | 4 |
| CASQ1 | ADRB3 | 0.730376 | 4 | 0 | 4 |
| CASQ1 | C3orf70 | 0.720981 | 4 | 0 | 4 |
| CASQ1 | NEGR1 | 0.720574 | 6 | 0 | 6 |
| CASQ1 | NRXN3 | 0.712729 | 6 | 0 | 5 |
| CASQ1 | FBXO30 | 0.712265 | 4 | 0 | 3 |
| CASQ1 | CHD5 | 0.707308 | 5 | 0 | 4 |
| CASQ1 | ENOX1 | 0.706803 | 6 | 0 | 6 |
| CASQ1 | RBPMS2 | 0.705548 | 5 | 0 | 4 |
| CASQ1 | ACTBL2 | 0.703809 | 3 | 0 | 3 |
| CASQ1 | ACTN2 | 0.702838 | 8 | 0 | 7 |
For details and further investigation, click here


