| Full name: glutamate ionotropic receptor AMPA type subunit 2 | Alias Symbol: GluA2|GLURB | ||
| Type: protein-coding gene | Cytoband: 4q32.1 | ||
| Entrez ID: 2891 | HGNC ID: HGNC:4572 | Ensembl Gene: ENSG00000120251 | OMIM ID: 138247 |
| Related drugs: (R,S)-AMPA, ANIRACETAM, BECAMPANEL, BUTABARBITAL, BUTALBITAL, BUTETHAL, CHEMBL1097939, CHEMBL123132, CHEMBL1255648, CHEMBL136800... [more] | |||
GRIA2 involved pathways:
Expression of GRIA2:
| Dataset | Gene | EntrezID | Probe | Log2FC | Adj.pValue | Expression |
|---|---|---|---|---|---|---|
| GSE17351 | GRIA2 | 2891 | 205358_at | -0.1596 | 0.6076 | |
| GSE20347 | GRIA2 | 2891 | 205358_at | 0.0786 | 0.2364 | |
| GSE23400 | GRIA2 | 2891 | 205358_at | -0.3002 | 0.0026 | |
| GSE26886 | GRIA2 | 2891 | 205358_at | 0.2722 | 0.1111 | |
| GSE29001 | GRIA2 | 2891 | 205358_at | 0.3536 | 0.5044 | |
| GSE38129 | GRIA2 | 2891 | 205358_at | -0.4692 | 0.0473 | |
| GSE45670 | GRIA2 | 2891 | 241172_at | 0.0413 | 0.5623 | |
| GSE53622 | GRIA2 | 2891 | 75810 | -0.0990 | 0.6061 | |
| GSE53624 | GRIA2 | 2891 | 75810 | -0.2135 | 0.1526 | |
| GSE63941 | GRIA2 | 2891 | 241172_at | 0.0097 | 0.9500 | |
| GSE77861 | GRIA2 | 2891 | 205358_at | -0.0538 | 0.6128 | |
| GSE97050 | GRIA2 | 2891 | A_33_P3230161 | -0.4826 | 0.3150 | |
| SRP133303 | GRIA2 | 2891 | RNAseq | -1.9090 | 0.0002 | |
| TCGA | GRIA2 | 2891 | RNAseq | -2.5379 | 0.0011 |
Upregulated datasets: 0; Downregulated datasets: 2.
Survival by GRIA2 expression:
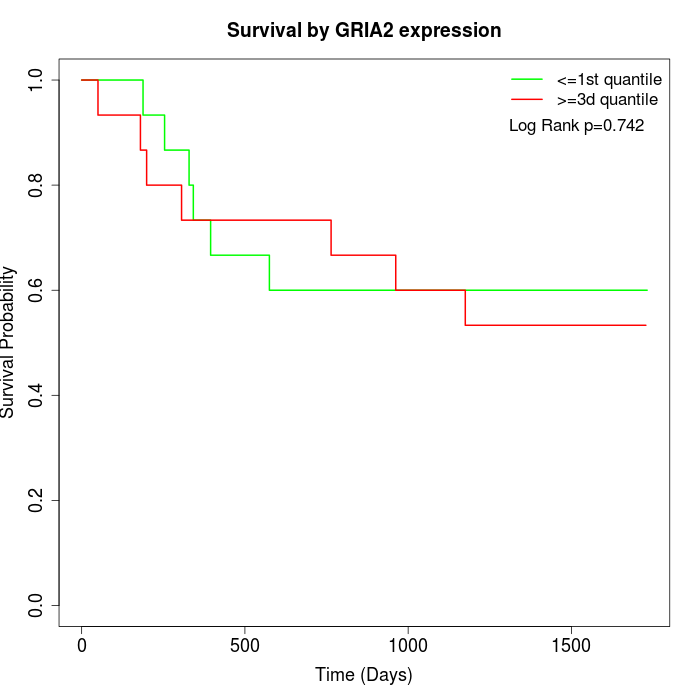 | 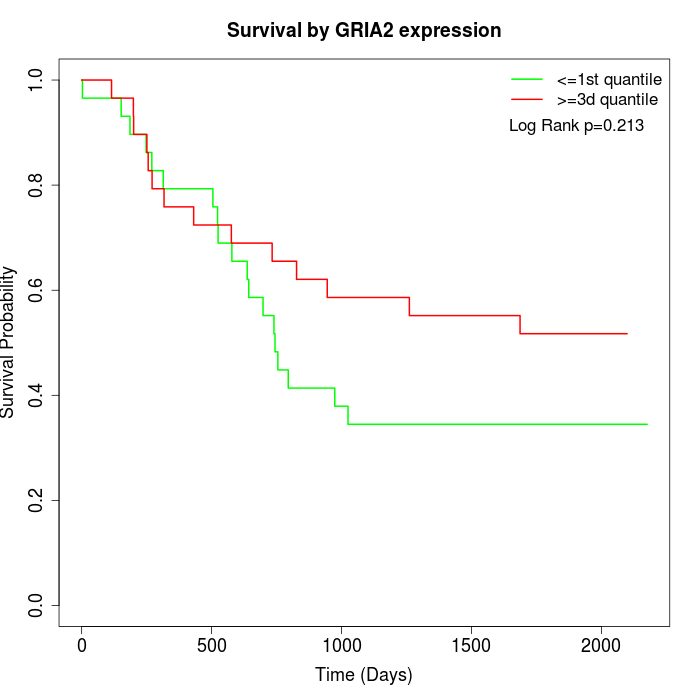 | 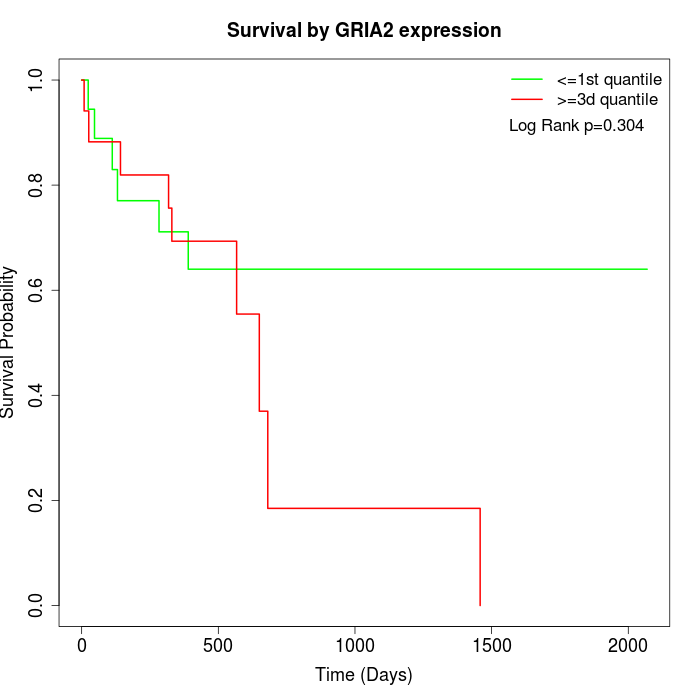 |
| GSE53622 | GSE53624 | TCGA |
Note: Click image to view full size file.
Copy number change of GRIA2:
| Dataset | Gene | EntrezID | Gain | Loss | Normal | Detail |
|---|---|---|---|---|---|---|
| GSE15526 | GRIA2 | 2891 | 0 | 16 | 14 | |
| GSE20123 | GRIA2 | 2891 | 0 | 15 | 15 | |
| GSE43470 | GRIA2 | 2891 | 0 | 14 | 29 | |
| GSE46452 | GRIA2 | 2891 | 1 | 36 | 22 | |
| GSE47630 | GRIA2 | 2891 | 0 | 23 | 17 | |
| GSE54993 | GRIA2 | 2891 | 10 | 0 | 60 | |
| GSE54994 | GRIA2 | 2891 | 1 | 12 | 40 | |
| GSE60625 | GRIA2 | 2891 | 0 | 1 | 10 | |
| GSE74703 | GRIA2 | 2891 | 0 | 12 | 24 | |
| GSE74704 | GRIA2 | 2891 | 0 | 8 | 12 | |
| TCGA | GRIA2 | 2891 | 11 | 35 | 50 |
Total number of gains: 23; Total number of losses: 172; Total Number of normals: 293.
Somatic mutations of GRIA2:
Generating mutation plots.
Highly correlated genes for GRIA2:
Showing top 20/134 corelated genes with mean PCC>0.5.
| Gene1 | Gene2 | Mean PCC | Num. Datasets | Num. PCC<0 | Num. PCC>0.5 |
|---|---|---|---|---|---|
| GRIA2 | MYBPC1 | 0.805596 | 3 | 0 | 3 |
| GRIA2 | ATP1B2 | 0.67625 | 3 | 0 | 3 |
| GRIA2 | FXYD1 | 0.672553 | 4 | 0 | 4 |
| GRIA2 | TUBB2B | 0.666601 | 3 | 0 | 3 |
| GRIA2 | MYCN | 0.664153 | 3 | 0 | 3 |
| GRIA2 | CRY2 | 0.658073 | 4 | 0 | 3 |
| GRIA2 | LINC00472 | 0.651921 | 4 | 0 | 3 |
| GRIA2 | DGKB | 0.650529 | 4 | 0 | 3 |
| GRIA2 | PHKA2 | 0.644749 | 3 | 0 | 3 |
| GRIA2 | ZNF449 | 0.640015 | 3 | 0 | 3 |
| GRIA2 | BEND5 | 0.638261 | 5 | 0 | 4 |
| GRIA2 | LPAR4 | 0.636514 | 5 | 0 | 4 |
| GRIA2 | ARHGAP6 | 0.63178 | 4 | 0 | 3 |
| GRIA2 | EYA1 | 0.631423 | 3 | 0 | 3 |
| GRIA2 | ATP7B | 0.628212 | 4 | 0 | 3 |
| GRIA2 | SBSPON | 0.627827 | 3 | 0 | 3 |
| GRIA2 | MLPH | 0.627602 | 4 | 0 | 4 |
| GRIA2 | KCNN3 | 0.626617 | 4 | 0 | 3 |
| GRIA2 | ZFP2 | 0.626555 | 3 | 0 | 3 |
| GRIA2 | PPP1R1A | 0.624188 | 4 | 0 | 3 |
For details and further investigation, click here