| Full name: glutathione S-transferase omega 2 | Alias Symbol: | ||
| Type: protein-coding gene | Cytoband: 10q25.1 | ||
| Entrez ID: 119391 | HGNC ID: HGNC:23064 | Ensembl Gene: ENSG00000065621 | OMIM ID: 612314 |
Expression of GSTO2:
| Dataset | Gene | EntrezID | Probe | Log2FC | Adj.pValue | Expression |
|---|---|---|---|---|---|---|
| GSE17351 | GSTO2 | 119391 | 227163_at | -0.4969 | 0.5327 | |
| GSE26886 | GSTO2 | 119391 | 227163_at | -0.9885 | 0.0257 | |
| GSE45670 | GSTO2 | 119391 | 227163_at | -0.1390 | 0.6610 | |
| GSE53622 | GSTO2 | 119391 | 31759 | -0.7379 | 0.0134 | |
| GSE53624 | GSTO2 | 119391 | 31759 | -1.0003 | 0.0000 | |
| GSE63941 | GSTO2 | 119391 | 227163_at | 3.2426 | 0.0343 | |
| GSE77861 | GSTO2 | 119391 | 227163_at | -0.3628 | 0.5572 | |
| GSE97050 | GSTO2 | 119391 | A_23_P202206 | 0.1582 | 0.8933 | |
| SRP007169 | GSTO2 | 119391 | RNAseq | -1.4002 | 0.0907 | |
| SRP008496 | GSTO2 | 119391 | RNAseq | -0.4548 | 0.3535 | |
| SRP064894 | GSTO2 | 119391 | RNAseq | -0.7200 | 0.0491 | |
| SRP133303 | GSTO2 | 119391 | RNAseq | -0.6153 | 0.0037 | |
| SRP159526 | GSTO2 | 119391 | RNAseq | 0.2077 | 0.7491 | |
| SRP193095 | GSTO2 | 119391 | RNAseq | -0.6320 | 0.0000 | |
| SRP219564 | GSTO2 | 119391 | RNAseq | -1.7251 | 0.0031 | |
| TCGA | GSTO2 | 119391 | RNAseq | -0.2783 | 0.2522 |
Upregulated datasets: 1; Downregulated datasets: 2.
Survival by GSTO2 expression:
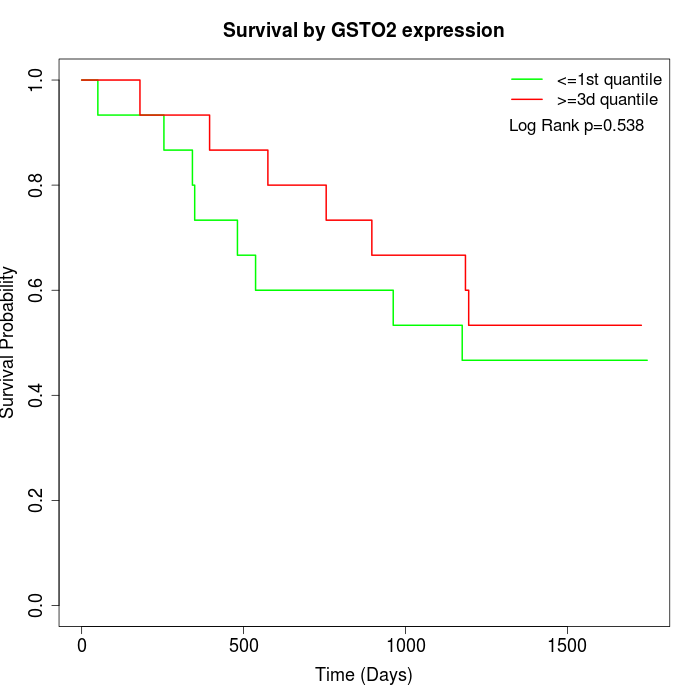 | 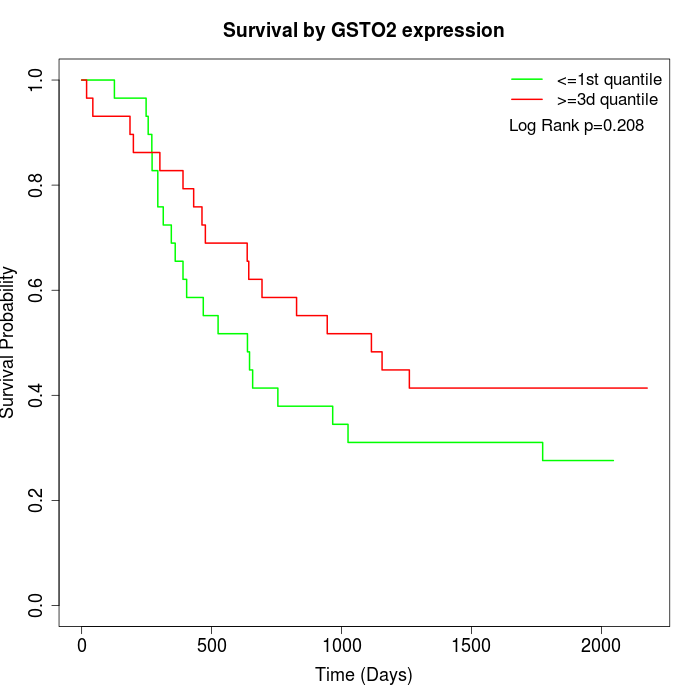 | 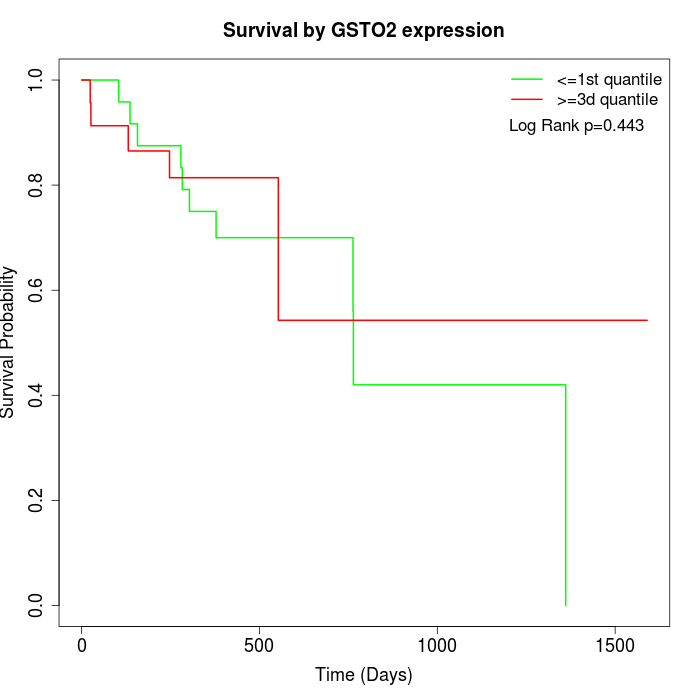 |
| GSE53622 | GSE53624 | TCGA |
Note: Click image to view full size file.
Copy number change of GSTO2:
| Dataset | Gene | EntrezID | Gain | Loss | Normal | Detail |
|---|---|---|---|---|---|---|
| GSE15526 | GSTO2 | 119391 | 1 | 10 | 19 | |
| GSE20123 | GSTO2 | 119391 | 1 | 8 | 21 | |
| GSE43470 | GSTO2 | 119391 | 0 | 7 | 36 | |
| GSE46452 | GSTO2 | 119391 | 0 | 11 | 48 | |
| GSE47630 | GSTO2 | 119391 | 2 | 14 | 24 | |
| GSE54993 | GSTO2 | 119391 | 8 | 0 | 62 | |
| GSE54994 | GSTO2 | 119391 | 1 | 10 | 42 | |
| GSE60625 | GSTO2 | 119391 | 0 | 0 | 11 | |
| GSE74703 | GSTO2 | 119391 | 0 | 5 | 31 | |
| GSE74704 | GSTO2 | 119391 | 0 | 4 | 16 | |
| TCGA | GSTO2 | 119391 | 6 | 28 | 62 |
Total number of gains: 19; Total number of losses: 97; Total Number of normals: 372.
Somatic mutations of GSTO2:
Generating mutation plots.
Highly correlated genes for GSTO2:
Showing top 20/179 corelated genes with mean PCC>0.5.
| Gene1 | Gene2 | Mean PCC | Num. Datasets | Num. PCC<0 | Num. PCC>0.5 |
|---|---|---|---|---|---|
| GSTO2 | SLC10A7 | 0.777702 | 3 | 0 | 3 |
| GSTO2 | RPS23 | 0.765123 | 3 | 0 | 3 |
| GSTO2 | SS18 | 0.73006 | 3 | 0 | 3 |
| GSTO2 | B4GALT5 | 0.720724 | 3 | 0 | 3 |
| GSTO2 | GTF3C6 | 0.719891 | 4 | 0 | 4 |
| GSTO2 | MTHFD1 | 0.712882 | 3 | 0 | 3 |
| GSTO2 | MRPL37 | 0.705441 | 3 | 0 | 3 |
| GSTO2 | GLMN | 0.689588 | 3 | 0 | 3 |
| GSTO2 | BDH2 | 0.684387 | 3 | 0 | 3 |
| GSTO2 | CELSR2 | 0.681951 | 3 | 0 | 3 |
| GSTO2 | ELP4 | 0.680586 | 3 | 0 | 3 |
| GSTO2 | RPL35 | 0.675317 | 3 | 0 | 3 |
| GSTO2 | YTHDC2 | 0.668417 | 3 | 0 | 3 |
| GSTO2 | RPS24 | 0.668069 | 4 | 0 | 3 |
| GSTO2 | RPS27 | 0.668028 | 3 | 0 | 3 |
| GSTO2 | ZDHHC6 | 0.66709 | 3 | 0 | 3 |
| GSTO2 | SORD | 0.666024 | 3 | 0 | 3 |
| GSTO2 | PLEKHH1 | 0.665826 | 3 | 0 | 3 |
| GSTO2 | HSPA2 | 0.659059 | 4 | 0 | 3 |
| GSTO2 | RDH11 | 0.657392 | 3 | 0 | 3 |
For details and further investigation, click here