| Full name: GTP binding protein 10 | Alias Symbol: DKFZP686A10121|FLJ38242|OBGH2 | ||
| Type: protein-coding gene | Cytoband: 7q21.13 | ||
| Entrez ID: 85865 | HGNC ID: HGNC:25106 | Ensembl Gene: ENSG00000105793 | OMIM ID: 610920 |
Expression of GTPBP10:
| Dataset | Gene | EntrezID | Probe | Log2FC | Adj.pValue | Expression |
|---|---|---|---|---|---|---|
| GSE17351 | GTPBP10 | 85865 | 236633_at | 0.0336 | 0.8850 | |
| GSE26886 | GTPBP10 | 85865 | 236633_at | 0.2230 | 0.0054 | |
| GSE45670 | GTPBP10 | 85865 | 236633_at | -0.1448 | 0.0343 | |
| GSE53622 | GTPBP10 | 85865 | 1718 | 0.4161 | 0.0000 | |
| GSE53624 | GTPBP10 | 85865 | 1718 | 0.3124 | 0.0000 | |
| GSE63941 | GTPBP10 | 85865 | 236633_at | 0.0565 | 0.6203 | |
| GSE77861 | GTPBP10 | 85865 | 236633_at | -0.0880 | 0.3576 | |
| GSE97050 | GTPBP10 | 85865 | A_33_P3467126 | -0.0342 | 0.8968 | |
| SRP007169 | GTPBP10 | 85865 | RNAseq | 0.0419 | 0.8969 | |
| SRP008496 | GTPBP10 | 85865 | RNAseq | 0.4342 | 0.1612 | |
| SRP064894 | GTPBP10 | 85865 | RNAseq | -0.0822 | 0.5692 | |
| SRP133303 | GTPBP10 | 85865 | RNAseq | 0.4279 | 0.0076 | |
| SRP159526 | GTPBP10 | 85865 | RNAseq | -0.0743 | 0.7816 | |
| SRP193095 | GTPBP10 | 85865 | RNAseq | 0.3469 | 0.0369 | |
| SRP219564 | GTPBP10 | 85865 | RNAseq | 0.5249 | 0.1947 | |
| TCGA | GTPBP10 | 85865 | RNAseq | 0.0827 | 0.2546 |
Upregulated datasets: 0; Downregulated datasets: 0.
Survival by GTPBP10 expression:
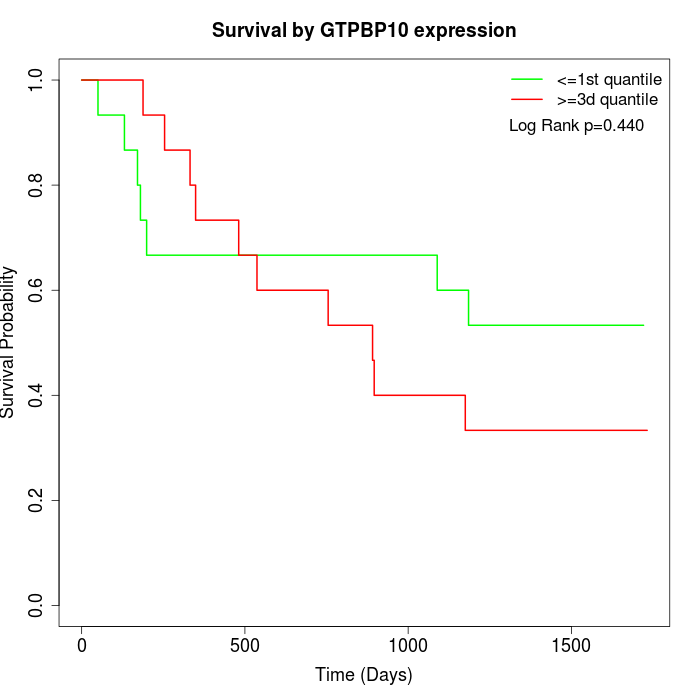 | 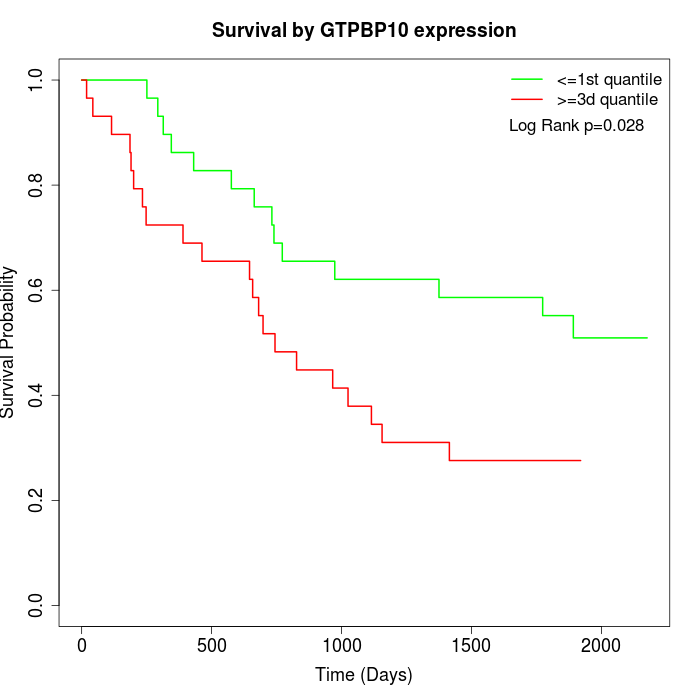 | 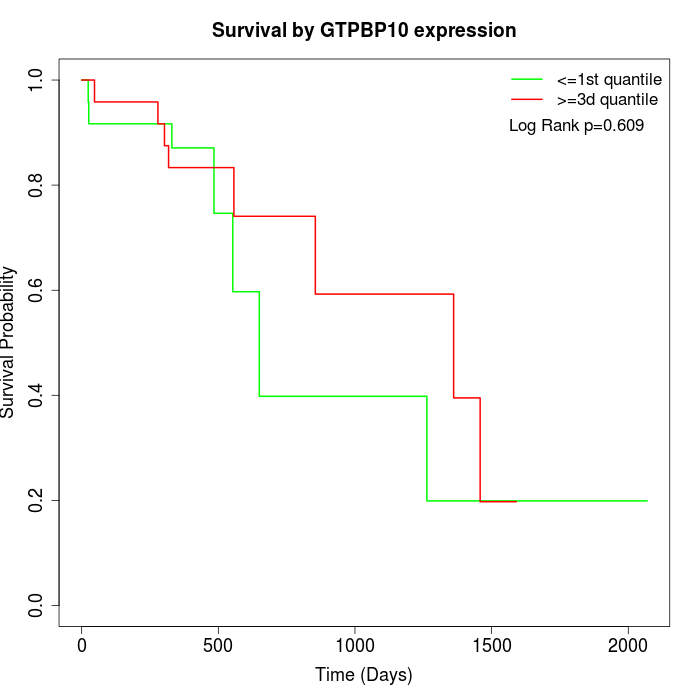 |
| GSE53622 | GSE53624 | TCGA |
Note: Click image to view full size file.
Copy number change of GTPBP10:
| Dataset | Gene | EntrezID | Gain | Loss | Normal | Detail |
|---|---|---|---|---|---|---|
| GSE15526 | GTPBP10 | 85865 | 13 | 1 | 16 | |
| GSE20123 | GTPBP10 | 85865 | 13 | 0 | 17 | |
| GSE43470 | GTPBP10 | 85865 | 6 | 1 | 36 | |
| GSE46452 | GTPBP10 | 85865 | 11 | 0 | 48 | |
| GSE47630 | GTPBP10 | 85865 | 9 | 2 | 29 | |
| GSE54993 | GTPBP10 | 85865 | 1 | 8 | 61 | |
| GSE54994 | GTPBP10 | 85865 | 17 | 2 | 34 | |
| GSE60625 | GTPBP10 | 85865 | 0 | 0 | 11 | |
| GSE74703 | GTPBP10 | 85865 | 5 | 1 | 30 | |
| GSE74704 | GTPBP10 | 85865 | 9 | 0 | 11 | |
| TCGA | GTPBP10 | 85865 | 55 | 6 | 35 |
Total number of gains: 139; Total number of losses: 21; Total Number of normals: 328.
Somatic mutations of GTPBP10:
Generating mutation plots.
Highly correlated genes for GTPBP10:
Showing top 20/224 corelated genes with mean PCC>0.5.
| Gene1 | Gene2 | Mean PCC | Num. Datasets | Num. PCC<0 | Num. PCC>0.5 |
|---|---|---|---|---|---|
| GTPBP10 | ATP1A4 | 0.795585 | 3 | 0 | 3 |
| GTPBP10 | ZNF358 | 0.788078 | 3 | 0 | 3 |
| GTPBP10 | GGN | 0.78187 | 3 | 0 | 3 |
| GTPBP10 | GPR37L1 | 0.763137 | 3 | 0 | 3 |
| GTPBP10 | RHOBTB2 | 0.754906 | 3 | 0 | 3 |
| GTPBP10 | PSKH1 | 0.754453 | 3 | 0 | 3 |
| GTPBP10 | GRIN3B | 0.752141 | 3 | 0 | 3 |
| GTPBP10 | COQ4 | 0.750272 | 3 | 0 | 3 |
| GTPBP10 | MAST2 | 0.746591 | 3 | 0 | 3 |
| GTPBP10 | PHACTR1 | 0.742483 | 3 | 0 | 3 |
| GTPBP10 | ADRM1 | 0.735989 | 3 | 0 | 3 |
| GTPBP10 | SSTR3 | 0.731888 | 3 | 0 | 3 |
| GTPBP10 | RBP5 | 0.726542 | 3 | 0 | 3 |
| GTPBP10 | WDR25 | 0.726008 | 3 | 0 | 3 |
| GTPBP10 | MRPS34 | 0.722735 | 3 | 0 | 3 |
| GTPBP10 | SARDH | 0.718777 | 4 | 0 | 3 |
| GTPBP10 | EPHA3 | 0.716739 | 3 | 0 | 3 |
| GTPBP10 | A4GALT | 0.716518 | 3 | 0 | 3 |
| GTPBP10 | PCBP3 | 0.71049 | 4 | 0 | 4 |
| GTPBP10 | ALG10B | 0.701181 | 3 | 0 | 3 |
For details and further investigation, click here