| Full name: interleukin 10 | Alias Symbol: CSIF|TGIF|IL10A|IL-10 | ||
| Type: protein-coding gene | Cytoband: 1q32.1 | ||
| Entrez ID: 3586 | HGNC ID: HGNC:5962 | Ensembl Gene: ENSG00000136634 | OMIM ID: 124092 |
| Related drugs: ACYCLOVIR, AMOXICILLIN, CLARITHROMYCIN, FLUTICASONE PROPIONATE, LISOFYLLINE, MESALAMINE, RABEPRAZOLE, ROFECOXIB, SCH-708980, SIROLIMUS... [more] | |||
IL10 involved pathways:
Expression of IL10:
| Dataset | Gene | EntrezID | Probe | Log2FC | Adj.pValue | Expression |
|---|---|---|---|---|---|---|
| GSE17351 | IL10 | 3586 | 207433_at | 0.1935 | 0.5516 | |
| GSE20347 | IL10 | 3586 | 207433_at | 0.0463 | 0.3539 | |
| GSE23400 | IL10 | 3586 | 207433_at | -0.0719 | 0.0070 | |
| GSE26886 | IL10 | 3586 | 207433_at | -0.0087 | 0.9546 | |
| GSE29001 | IL10 | 3586 | 207433_at | 0.1008 | 0.3579 | |
| GSE38129 | IL10 | 3586 | 207433_at | 0.0701 | 0.1507 | |
| GSE45670 | IL10 | 3586 | 207433_at | 0.1291 | 0.3744 | |
| GSE53622 | IL10 | 3586 | 82677 | 0.5856 | 0.0020 | |
| GSE53624 | IL10 | 3586 | 86113 | 0.4636 | 0.0011 | |
| GSE63941 | IL10 | 3586 | 207433_at | 0.0823 | 0.5541 | |
| GSE77861 | IL10 | 3586 | 207433_at | 0.0010 | 0.9922 | |
| GSE97050 | IL10 | 3586 | A_23_P126735 | 0.2671 | 0.2120 | |
| SRP064894 | IL10 | 3586 | RNAseq | 0.5261 | 0.1202 | |
| SRP133303 | IL10 | 3586 | RNAseq | 0.4114 | 0.0662 | |
| SRP193095 | IL10 | 3586 | RNAseq | 0.9535 | 0.0000 | |
| SRP219564 | IL10 | 3586 | RNAseq | 1.5618 | 0.0677 | |
| TCGA | IL10 | 3586 | RNAseq | 0.4651 | 0.1359 |
Upregulated datasets: 0; Downregulated datasets: 0.
Survival by IL10 expression:
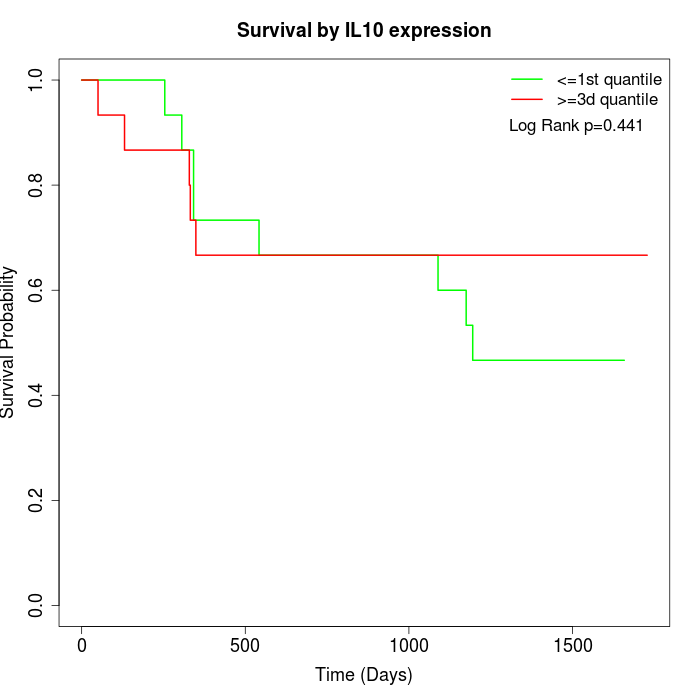 | 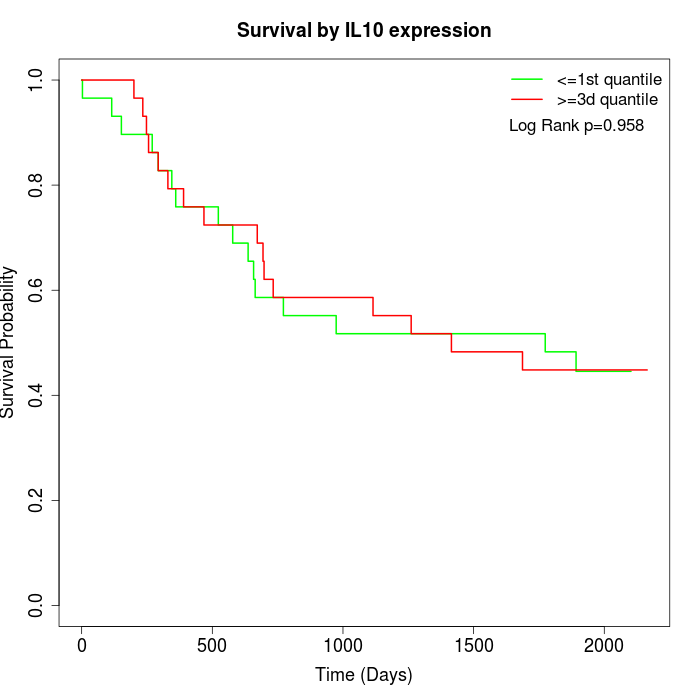 | 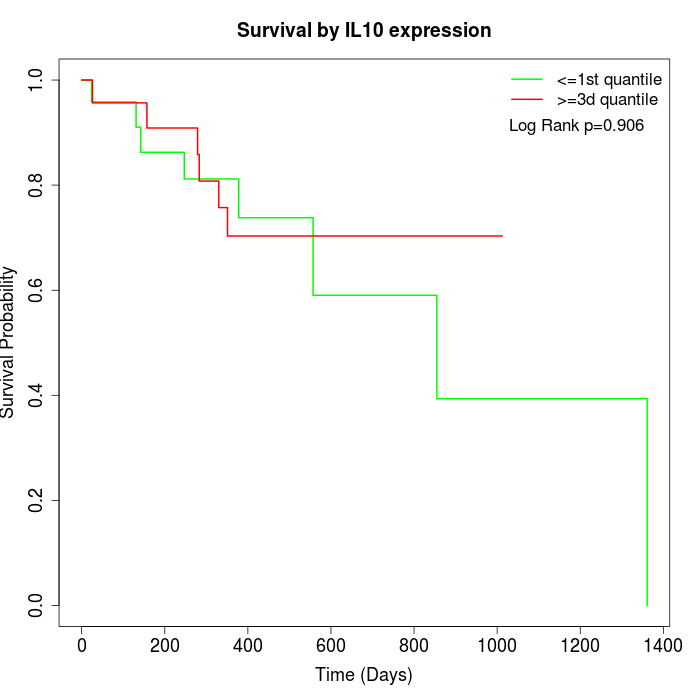 |
| GSE53622 | GSE53624 | TCGA |
Note: Click image to view full size file.
Copy number change of IL10:
| Dataset | Gene | EntrezID | Gain | Loss | Normal | Detail |
|---|---|---|---|---|---|---|
| GSE15526 | IL10 | 3586 | 11 | 0 | 19 | |
| GSE20123 | IL10 | 3586 | 11 | 0 | 19 | |
| GSE43470 | IL10 | 3586 | 7 | 0 | 36 | |
| GSE46452 | IL10 | 3586 | 3 | 1 | 55 | |
| GSE47630 | IL10 | 3586 | 14 | 0 | 26 | |
| GSE54993 | IL10 | 3586 | 0 | 6 | 64 | |
| GSE54994 | IL10 | 3586 | 14 | 0 | 39 | |
| GSE60625 | IL10 | 3586 | 0 | 0 | 11 | |
| GSE74703 | IL10 | 3586 | 7 | 0 | 29 | |
| GSE74704 | IL10 | 3586 | 5 | 0 | 15 | |
| TCGA | IL10 | 3586 | 44 | 4 | 48 |
Total number of gains: 116; Total number of losses: 11; Total Number of normals: 361.
Somatic mutations of IL10:
Generating mutation plots.
Highly correlated genes for IL10:
Showing top 20/184 corelated genes with mean PCC>0.5.
| Gene1 | Gene2 | Mean PCC | Num. Datasets | Num. PCC<0 | Num. PCC>0.5 |
|---|---|---|---|---|---|
| IL10 | RGS3 | 0.664519 | 5 | 0 | 5 |
| IL10 | CCL3 | 0.638051 | 3 | 0 | 3 |
| IL10 | CMTM2 | 0.631108 | 4 | 0 | 3 |
| IL10 | DACT1 | 0.628636 | 5 | 0 | 4 |
| IL10 | NRROS | 0.626634 | 3 | 0 | 3 |
| IL10 | PLXNC1 | 0.620943 | 5 | 0 | 4 |
| IL10 | CEP120 | 0.620701 | 3 | 0 | 3 |
| IL10 | CD101 | 0.616774 | 4 | 0 | 3 |
| IL10 | LINC01449 | 0.614346 | 3 | 0 | 3 |
| IL10 | ADAMTS16 | 0.613959 | 3 | 0 | 3 |
| IL10 | GDF9 | 0.608566 | 4 | 0 | 3 |
| IL10 | C5AR1 | 0.600698 | 7 | 0 | 4 |
| IL10 | FNDC1 | 0.597536 | 4 | 0 | 3 |
| IL10 | GREM1 | 0.596582 | 4 | 0 | 3 |
| IL10 | C1orf216 | 0.593904 | 4 | 0 | 3 |
| IL10 | IFNA7 | 0.593336 | 4 | 0 | 3 |
| IL10 | SRGN | 0.590298 | 6 | 0 | 3 |
| IL10 | LHFPL2 | 0.5898 | 6 | 0 | 4 |
| IL10 | FCGR3B | 0.589569 | 4 | 0 | 3 |
| IL10 | GPR65 | 0.588161 | 5 | 0 | 3 |
For details and further investigation, click here