| Full name: interleukin 13 | Alias Symbol: P600|IL-13|ALRH|BHR1|MGC116786|MGC116788|MGC116789 | ||
| Type: protein-coding gene | Cytoband: 5q31.1 | ||
| Entrez ID: 3596 | HGNC ID: HGNC:5973 | Ensembl Gene: ENSG00000169194 | OMIM ID: 147683 |
| Related drugs: ANRUKINZUMAB, INTERFERON BETA-1A, LEBRIKIZUMAB, QAX-576, TNX-650, TRALOKINUMAB... [more] | |||
IL13 involved pathways:
| KEGG pathway | Description | View |
|---|---|---|
| hsa04630 | Jak-STAT signaling pathway | |
| hsa05321 | Inflammatory bowel disease (IBD) |
Expression of IL13:
| Dataset | Gene | EntrezID | Probe | Log2FC | Adj.pValue | Expression |
|---|---|---|---|---|---|---|
| GSE17351 | IL13 | 3596 | 207844_at | -0.0486 | 0.8840 | |
| GSE20347 | IL13 | 3596 | 207844_at | -0.0673 | 0.4744 | |
| GSE23400 | IL13 | 3596 | 207844_at | -0.1335 | 0.0003 | |
| GSE26886 | IL13 | 3596 | 207844_at | 0.1694 | 0.0797 | |
| GSE29001 | IL13 | 3596 | 207844_at | -0.0691 | 0.7124 | |
| GSE38129 | IL13 | 3596 | 207844_at | -0.1073 | 0.2980 | |
| GSE45670 | IL13 | 3596 | 207844_at | 0.0420 | 0.7003 | |
| GSE53622 | IL13 | 3596 | 826 | -0.4452 | 0.0112 | |
| GSE53624 | IL13 | 3596 | 826 | 0.2468 | 0.1768 | |
| GSE63941 | IL13 | 3596 | 207844_at | 0.1295 | 0.4225 | |
| GSE77861 | IL13 | 3596 | 207844_at | -0.0087 | 0.9540 | |
| TCGA | IL13 | 3596 | RNAseq | -1.6772 | 0.2008 |
Upregulated datasets: 0; Downregulated datasets: 0.
Survival by IL13 expression:
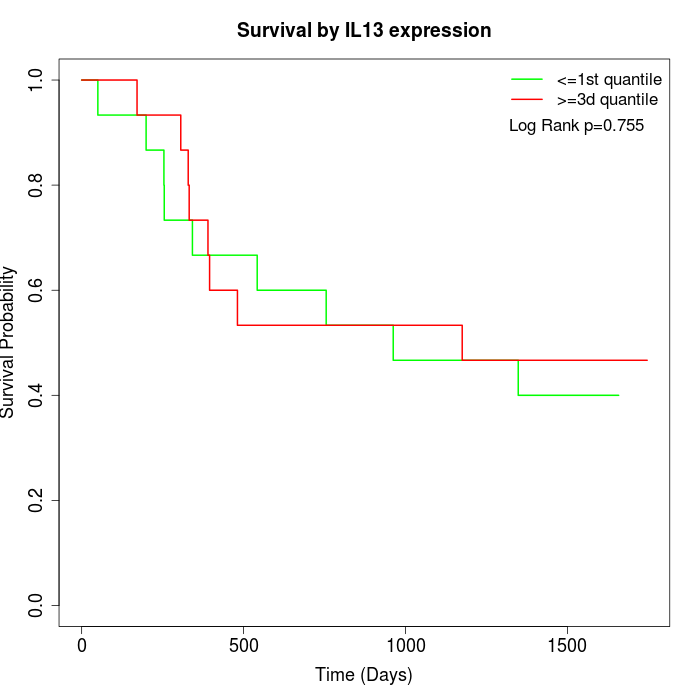 | 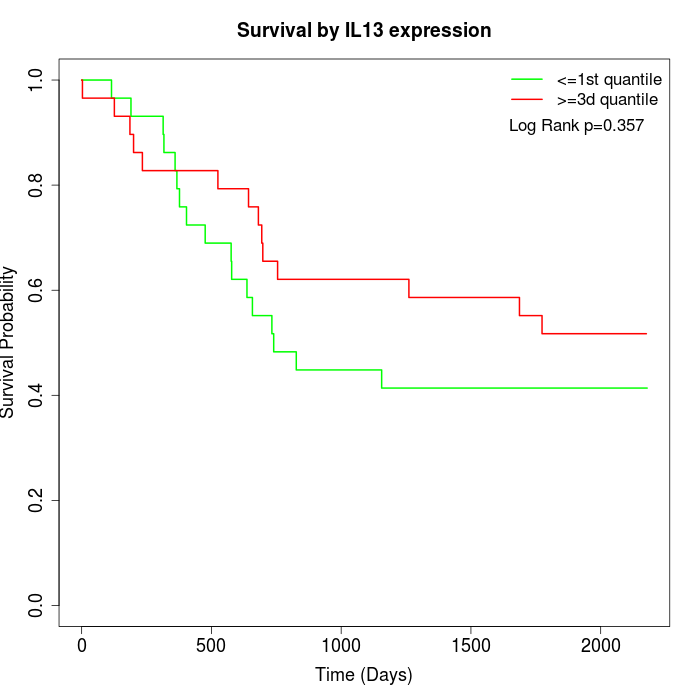 | 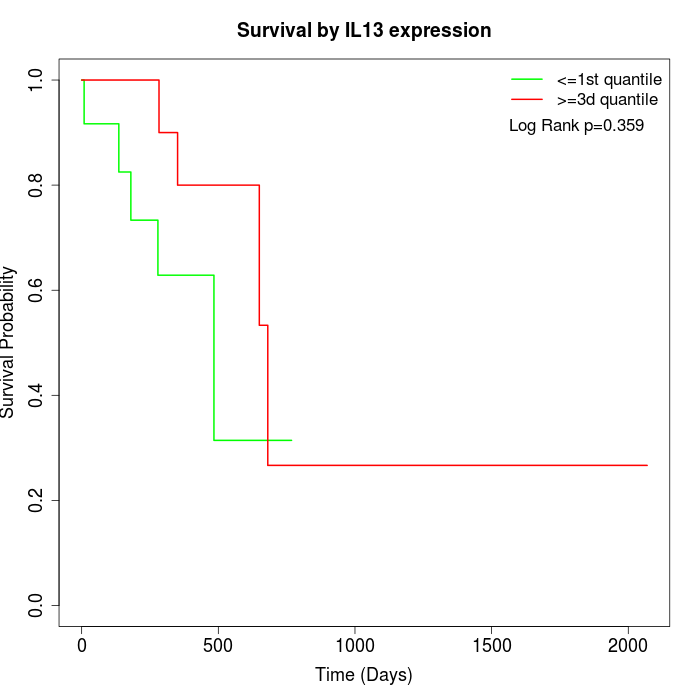 |
| GSE53622 | GSE53624 | TCGA |
Note: Click image to view full size file.
Copy number change of IL13:
| Dataset | Gene | EntrezID | Gain | Loss | Normal | Detail |
|---|---|---|---|---|---|---|
| GSE15526 | IL13 | 3596 | 1 | 11 | 18 | |
| GSE20123 | IL13 | 3596 | 2 | 11 | 17 | |
| GSE43470 | IL13 | 3596 | 2 | 9 | 32 | |
| GSE46452 | IL13 | 3596 | 0 | 27 | 32 | |
| GSE47630 | IL13 | 3596 | 0 | 21 | 19 | |
| GSE54993 | IL13 | 3596 | 9 | 1 | 60 | |
| GSE54994 | IL13 | 3596 | 2 | 14 | 37 | |
| GSE60625 | IL13 | 3596 | 0 | 0 | 11 | |
| GSE74703 | IL13 | 3596 | 2 | 6 | 28 | |
| GSE74704 | IL13 | 3596 | 1 | 5 | 14 | |
| TCGA | IL13 | 3596 | 3 | 39 | 54 |
Total number of gains: 22; Total number of losses: 144; Total Number of normals: 322.
Somatic mutations of IL13:
Generating mutation plots.
Highly correlated genes for IL13:
Showing top 20/832 corelated genes with mean PCC>0.5.
| Gene1 | Gene2 | Mean PCC | Num. Datasets | Num. PCC<0 | Num. PCC>0.5 |
|---|---|---|---|---|---|
| IL13 | BCAN | 0.755162 | 5 | 0 | 5 |
| IL13 | C3orf36 | 0.708318 | 5 | 0 | 5 |
| IL13 | GJB1 | 0.700211 | 7 | 0 | 7 |
| IL13 | HRC | 0.699817 | 3 | 0 | 3 |
| IL13 | EDA2R | 0.687327 | 5 | 0 | 5 |
| IL13 | IRS4 | 0.682238 | 4 | 0 | 4 |
| IL13 | AMN | 0.681806 | 7 | 0 | 7 |
| IL13 | DAB1 | 0.678352 | 4 | 0 | 4 |
| IL13 | CNGB3 | 0.676932 | 4 | 0 | 4 |
| IL13 | KRT38 | 0.675433 | 4 | 0 | 4 |
| IL13 | CER1 | 0.673774 | 5 | 0 | 5 |
| IL13 | PRTN3 | 0.671633 | 4 | 0 | 4 |
| IL13 | BRINP2 | 0.668012 | 4 | 0 | 4 |
| IL13 | MAPK11 | 0.667486 | 4 | 0 | 4 |
| IL13 | RUNX2 | 0.664846 | 5 | 0 | 5 |
| IL13 | MMP8 | 0.664822 | 3 | 0 | 3 |
| IL13 | ART1 | 0.663384 | 5 | 0 | 5 |
| IL13 | UMOD | 0.661228 | 6 | 0 | 6 |
| IL13 | TNFSF8 | 0.657788 | 4 | 0 | 3 |
| IL13 | FGB | 0.657353 | 6 | 0 | 5 |
For details and further investigation, click here