| Full name: proteinase 3 | Alias Symbol: PR-3|ACPA|C-ANCA|AGP7|MBT|P29 | ||
| Type: protein-coding gene | Cytoband: 19p13.3 | ||
| Entrez ID: 5657 | HGNC ID: HGNC:9495 | Ensembl Gene: ENSG00000196415 | OMIM ID: 177020 |
| Related drugs: MYCOPHENOLATE MOFETIL, REGRAMOSTIM, TIPRELESTAT... [more] | |||
Screen Evidence:
| |||
Expression of PRTN3:
| Dataset | Gene | EntrezID | Probe | Log2FC | Adj.pValue | Expression |
|---|---|---|---|---|---|---|
| GSE17351 | PRTN3 | 5657 | 207341_at | 0.0434 | 0.8797 | |
| GSE20347 | PRTN3 | 5657 | 207341_at | -0.0706 | 0.2450 | |
| GSE23400 | PRTN3 | 5657 | 207341_at | -0.0793 | 0.0021 | |
| GSE26886 | PRTN3 | 5657 | 207341_at | 0.2284 | 0.0349 | |
| GSE29001 | PRTN3 | 5657 | 207341_at | -0.1335 | 0.3285 | |
| GSE38129 | PRTN3 | 5657 | 207341_at | -0.1397 | 0.0049 | |
| GSE45670 | PRTN3 | 5657 | 207341_at | 0.0011 | 0.9899 | |
| GSE53622 | PRTN3 | 5657 | 88453 | 0.8914 | 0.0000 | |
| GSE53624 | PRTN3 | 5657 | 88453 | 0.6456 | 0.0000 | |
| GSE63941 | PRTN3 | 5657 | 207341_at | 0.0557 | 0.6950 | |
| GSE77861 | PRTN3 | 5657 | 207341_at | -0.0751 | 0.4165 | |
| GSE97050 | PRTN3 | 5657 | A_23_P142345 | -0.0039 | 0.9909 | |
| TCGA | PRTN3 | 5657 | RNAseq | 1.0452 | 0.4886 |
Upregulated datasets: 0; Downregulated datasets: 0.
Survival by PRTN3 expression:
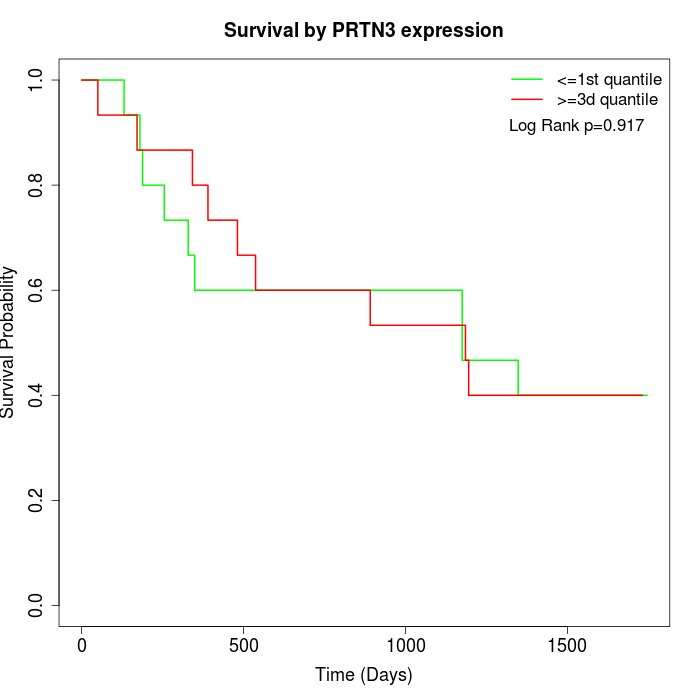 | 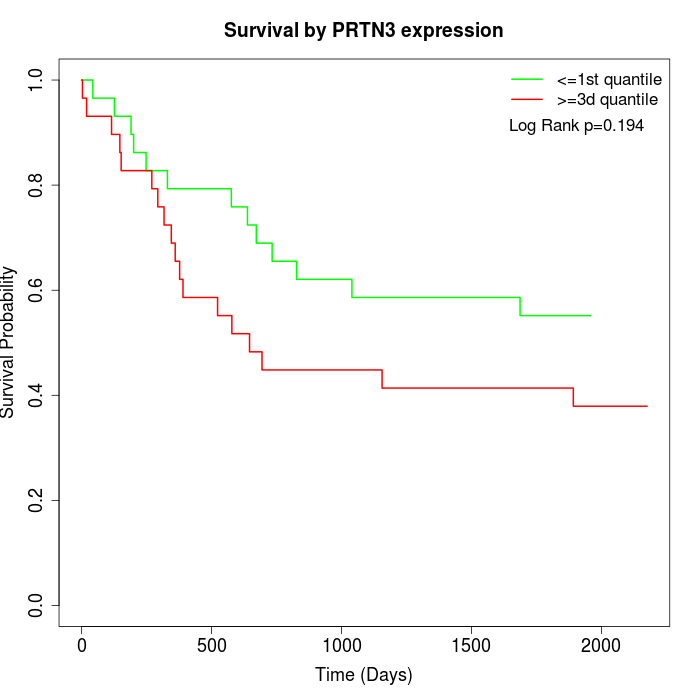 | 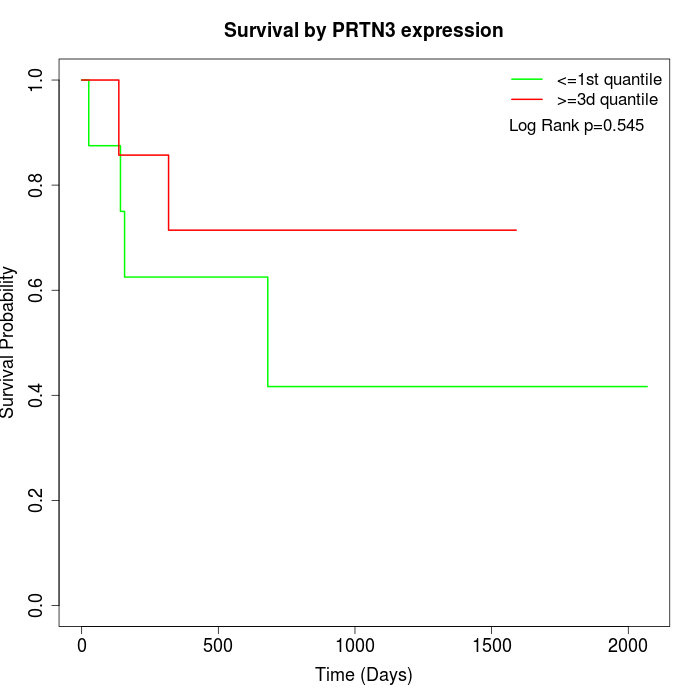 |
| GSE53622 | GSE53624 | TCGA |
Note: Click image to view full size file.
Copy number change of PRTN3:
| Dataset | Gene | EntrezID | Gain | Loss | Normal | Detail |
|---|---|---|---|---|---|---|
| GSE15526 | PRTN3 | 5657 | 4 | 6 | 20 | |
| GSE20123 | PRTN3 | 5657 | 4 | 5 | 21 | |
| GSE43470 | PRTN3 | 5657 | 1 | 10 | 32 | |
| GSE46452 | PRTN3 | 5657 | 47 | 1 | 11 | |
| GSE47630 | PRTN3 | 5657 | 5 | 7 | 28 | |
| GSE54993 | PRTN3 | 5657 | 13 | 4 | 53 | |
| GSE54994 | PRTN3 | 5657 | 8 | 15 | 30 | |
| GSE60625 | PRTN3 | 5657 | 9 | 0 | 2 | |
| GSE74703 | PRTN3 | 5657 | 1 | 7 | 28 | |
| GSE74704 | PRTN3 | 5657 | 3 | 3 | 14 | |
| TCGA | PRTN3 | 5657 | 8 | 25 | 63 |
Total number of gains: 103; Total number of losses: 83; Total Number of normals: 302.
Somatic mutations of PRTN3:
Generating mutation plots.
Highly correlated genes for PRTN3:
Showing top 20/395 corelated genes with mean PCC>0.5.
| Gene1 | Gene2 | Mean PCC | Num. Datasets | Num. PCC<0 | Num. PCC>0.5 |
|---|---|---|---|---|---|
| PRTN3 | PLEK | 0.790976 | 3 | 0 | 3 |
| PRTN3 | PDE3B | 0.777657 | 3 | 0 | 3 |
| PRTN3 | LRTOMT | 0.728076 | 3 | 0 | 3 |
| PRTN3 | SLC6A6 | 0.723392 | 3 | 0 | 3 |
| PRTN3 | SST | 0.717444 | 4 | 0 | 4 |
| PRTN3 | HHLA3 | 0.710565 | 3 | 0 | 3 |
| PRTN3 | TERF2 | 0.707298 | 3 | 0 | 3 |
| PRTN3 | ACY1 | 0.702599 | 3 | 0 | 3 |
| PRTN3 | ZBTB33 | 0.702218 | 3 | 0 | 3 |
| PRTN3 | IL2RG | 0.700663 | 3 | 0 | 3 |
| PRTN3 | GRIN2B | 0.697213 | 3 | 0 | 3 |
| PRTN3 | RABEP2 | 0.696914 | 4 | 0 | 3 |
| PRTN3 | CST8 | 0.695115 | 3 | 0 | 3 |
| PRTN3 | APBA1 | 0.692866 | 4 | 0 | 4 |
| PRTN3 | PCDH12 | 0.691383 | 3 | 0 | 3 |
| PRTN3 | MAP1A | 0.691192 | 3 | 0 | 3 |
| PRTN3 | CLDN18 | 0.688737 | 4 | 0 | 3 |
| PRTN3 | RASSF4 | 0.688236 | 4 | 0 | 3 |
| PRTN3 | CELA3A | 0.687932 | 4 | 0 | 4 |
| PRTN3 | TCP10L | 0.68264 | 4 | 0 | 4 |
For details and further investigation, click here