| Full name: interleukin 2 | Alias Symbol: IL-2|TCGF | ||
| Type: protein-coding gene | Cytoband: 4q27 | ||
| Entrez ID: 3558 | HGNC ID: HGNC:6001 | Ensembl Gene: ENSG00000109471 | OMIM ID: 147680 |
| Related drugs: ACETAMINOPHEN, AMIKACIN SULFATE, AZIRIDINE, BECLOMETHASONE, BROMOCRIPTINE, CALCITRIOL, CEFEPIME, CLOZAPINE, CYCLOSPORINE, DIDEMNIN B... [more] | |||
IL2 involved pathways:
| KEGG pathway | Description | View |
|---|---|---|
| hsa04151 | PI3K-Akt signaling pathway | |
| hsa04630 | Jak-STAT signaling pathway | |
| hsa05162 | Measles | |
| hsa05321 | Inflammatory bowel disease (IBD) |
Expression of IL2:
| Dataset | Gene | EntrezID | Probe | Log2FC | Adj.pValue | Expression |
|---|---|---|---|---|---|---|
| GSE17351 | IL2 | 3558 | 207849_at | -0.1607 | 0.4869 | |
| GSE20347 | IL2 | 3558 | 207849_at | -0.1221 | 0.0044 | |
| GSE23400 | IL2 | 3558 | 207849_at | -0.0913 | 0.0000 | |
| GSE26886 | IL2 | 3558 | 207849_at | -0.0235 | 0.7910 | |
| GSE29001 | IL2 | 3558 | 207849_at | -0.2491 | 0.0054 | |
| GSE38129 | IL2 | 3558 | 207849_at | -0.1245 | 0.0010 | |
| GSE45670 | IL2 | 3558 | 207849_at | -0.0929 | 0.2202 | |
| GSE53622 | IL2 | 3558 | 120542 | -3.2664 | 0.0000 | |
| GSE53624 | IL2 | 3558 | 120542 | -4.1023 | 0.0000 | |
| GSE63941 | IL2 | 3558 | 207849_at | 0.0016 | 0.9915 | |
| GSE77861 | IL2 | 3558 | 207849_at | -0.0512 | 0.5922 | |
| TCGA | IL2 | 3558 | RNAseq | 0.3551 | 0.8494 |
Upregulated datasets: 0; Downregulated datasets: 2.
Survival by IL2 expression:
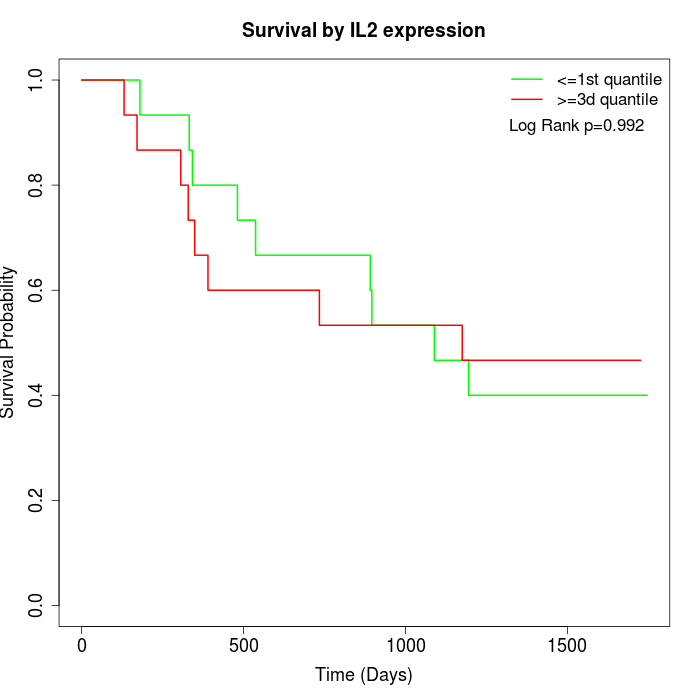 | 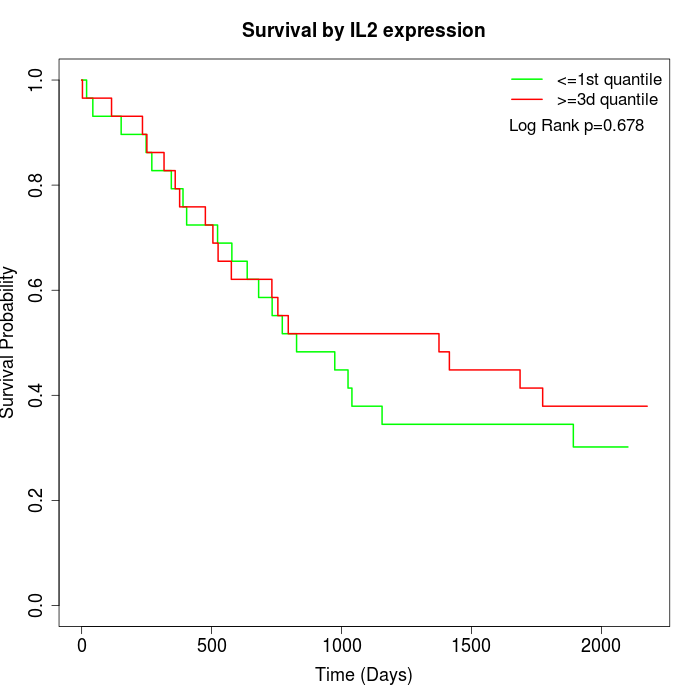 | 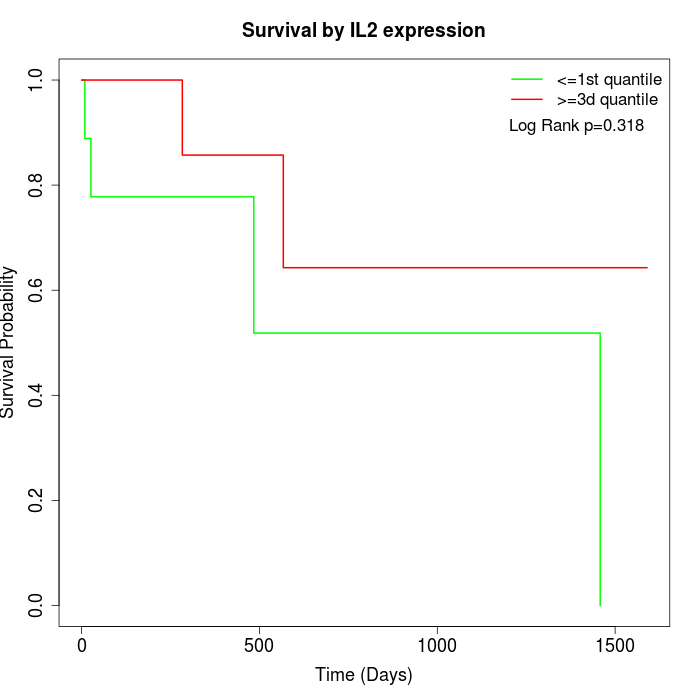 |
| GSE53622 | GSE53624 | TCGA |
Note: Click image to view full size file.
Copy number change of IL2:
| Dataset | Gene | EntrezID | Gain | Loss | Normal | Detail |
|---|---|---|---|---|---|---|
| GSE15526 | IL2 | 3558 | 0 | 13 | 17 | |
| GSE20123 | IL2 | 3558 | 0 | 13 | 17 | |
| GSE43470 | IL2 | 3558 | 0 | 13 | 30 | |
| GSE46452 | IL2 | 3558 | 1 | 36 | 22 | |
| GSE47630 | IL2 | 3558 | 0 | 22 | 18 | |
| GSE54993 | IL2 | 3558 | 9 | 0 | 61 | |
| GSE54994 | IL2 | 3558 | 1 | 10 | 42 | |
| GSE60625 | IL2 | 3558 | 0 | 1 | 10 | |
| GSE74703 | IL2 | 3558 | 0 | 11 | 25 | |
| GSE74704 | IL2 | 3558 | 0 | 7 | 13 | |
| TCGA | IL2 | 3558 | 8 | 35 | 53 |
Total number of gains: 19; Total number of losses: 161; Total Number of normals: 308.
Somatic mutations of IL2:
Generating mutation plots.
Highly correlated genes for IL2:
Showing top 20/849 corelated genes with mean PCC>0.5.
| Gene1 | Gene2 | Mean PCC | Num. Datasets | Num. PCC<0 | Num. PCC>0.5 |
|---|---|---|---|---|---|
| IL2 | IL34 | 0.75326 | 3 | 0 | 3 |
| IL2 | IQCF1 | 0.74946 | 3 | 0 | 3 |
| IL2 | HRCT1 | 0.734472 | 3 | 0 | 3 |
| IL2 | OXT | 0.728415 | 3 | 0 | 3 |
| IL2 | STRADB | 0.711467 | 3 | 0 | 3 |
| IL2 | FNDC4 | 0.706557 | 6 | 0 | 6 |
| IL2 | SPINK13 | 0.704928 | 3 | 0 | 3 |
| IL2 | C6orf132 | 0.702759 | 3 | 0 | 3 |
| IL2 | SHROOM3 | 0.697024 | 3 | 0 | 3 |
| IL2 | SMIM5 | 0.685005 | 4 | 0 | 4 |
| IL2 | C18orf25 | 0.682011 | 6 | 0 | 6 |
| IL2 | C15orf62 | 0.681461 | 3 | 0 | 3 |
| IL2 | ANGPTL7 | 0.679614 | 4 | 0 | 4 |
| IL2 | BOK | 0.678882 | 4 | 0 | 3 |
| IL2 | CSTB | 0.674449 | 6 | 0 | 5 |
| IL2 | HOPX | 0.668102 | 7 | 0 | 6 |
| IL2 | MAL | 0.665787 | 7 | 0 | 5 |
| IL2 | SPATA19 | 0.665008 | 4 | 0 | 3 |
| IL2 | PTK6 | 0.664293 | 7 | 0 | 7 |
| IL2 | IL12A-AS1 | 0.664169 | 4 | 0 | 3 |
For details and further investigation, click here