| Full name: inhibin subunit alpha | Alias Symbol: | ||
| Type: protein-coding gene | Cytoband: 2q35 | ||
| Entrez ID: 3623 | HGNC ID: HGNC:6065 | Ensembl Gene: ENSG00000123999 | OMIM ID: 147380 |
Expression of INHA:
| Dataset | Gene | EntrezID | Probe | Log2FC | Adj.pValue | Expression |
|---|---|---|---|---|---|---|
| GSE17351 | INHA | 3623 | 210141_s_at | 0.0163 | 0.9529 | |
| GSE20347 | INHA | 3623 | 210141_s_at | -0.0742 | 0.2560 | |
| GSE23400 | INHA | 3623 | 210141_s_at | -0.0526 | 0.2600 | |
| GSE26886 | INHA | 3623 | 210141_s_at | 0.6367 | 0.0000 | |
| GSE29001 | INHA | 3623 | 210141_s_at | -0.1016 | 0.6244 | |
| GSE38129 | INHA | 3623 | 210141_s_at | -0.1290 | 0.0627 | |
| GSE45670 | INHA | 3623 | 210141_s_at | -0.1001 | 0.3433 | |
| GSE53622 | INHA | 3623 | 117785 | 0.2880 | 0.0376 | |
| GSE53624 | INHA | 3623 | 117785 | 0.7047 | 0.0000 | |
| GSE63941 | INHA | 3623 | 210141_s_at | 0.3111 | 0.1222 | |
| GSE77861 | INHA | 3623 | 210141_s_at | -0.0554 | 0.6925 | |
| SRP159526 | INHA | 3623 | RNAseq | 1.3471 | 0.0570 | |
| SRP219564 | INHA | 3623 | RNAseq | 1.4147 | 0.0500 | |
| TCGA | INHA | 3623 | RNAseq | 1.2267 | 0.0006 |
Upregulated datasets: 1; Downregulated datasets: 0.
Survival by INHA expression:
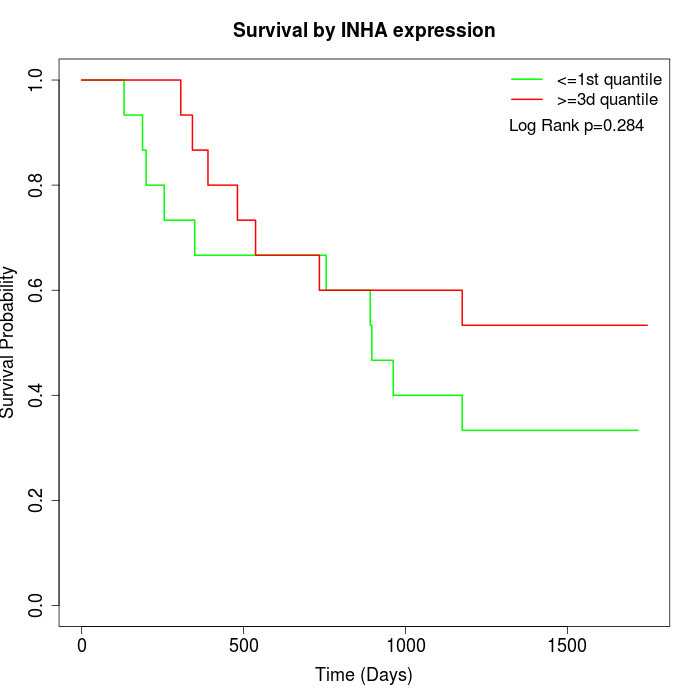 | 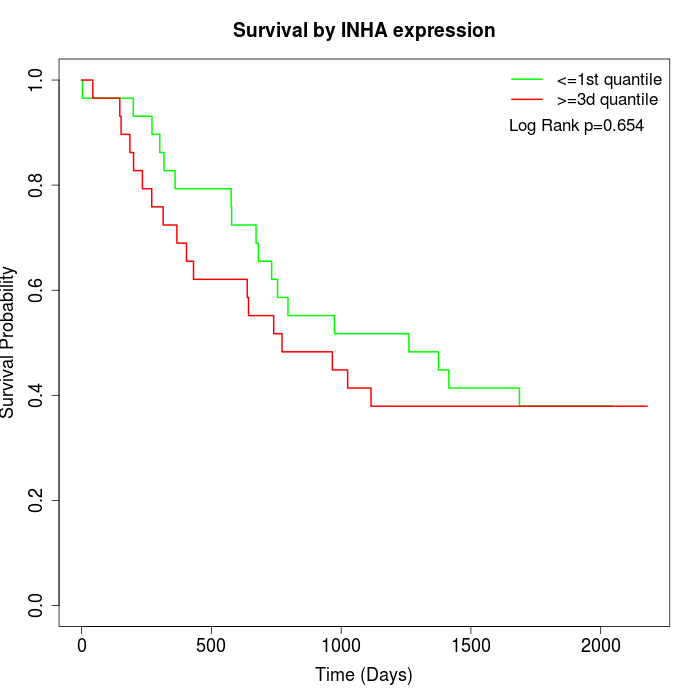 |  |
| GSE53622 | GSE53624 | TCGA |
Note: Click image to view full size file.
Copy number change of INHA:
| Dataset | Gene | EntrezID | Gain | Loss | Normal | Detail |
|---|---|---|---|---|---|---|
| GSE15526 | INHA | 3623 | 2 | 14 | 14 | |
| GSE20123 | INHA | 3623 | 2 | 13 | 15 | |
| GSE43470 | INHA | 3623 | 1 | 6 | 36 | |
| GSE46452 | INHA | 3623 | 0 | 5 | 54 | |
| GSE47630 | INHA | 3623 | 4 | 5 | 31 | |
| GSE54993 | INHA | 3623 | 1 | 2 | 67 | |
| GSE54994 | INHA | 3623 | 8 | 9 | 36 | |
| GSE60625 | INHA | 3623 | 0 | 3 | 8 | |
| GSE74703 | INHA | 3623 | 1 | 5 | 30 | |
| GSE74704 | INHA | 3623 | 2 | 7 | 11 | |
| TCGA | INHA | 3623 | 13 | 25 | 58 |
Total number of gains: 34; Total number of losses: 94; Total Number of normals: 360.
Somatic mutations of INHA:
Generating mutation plots.
Highly correlated genes for INHA:
Showing top 20/318 corelated genes with mean PCC>0.5.
| Gene1 | Gene2 | Mean PCC | Num. Datasets | Num. PCC<0 | Num. PCC>0.5 |
|---|---|---|---|---|---|
| INHA | IL18BP | 0.734013 | 3 | 0 | 3 |
| INHA | DCC | 0.714545 | 3 | 0 | 3 |
| INHA | MUC13 | 0.708942 | 4 | 0 | 4 |
| INHA | DNMT3L | 0.70852 | 3 | 0 | 3 |
| INHA | PRX | 0.688961 | 3 | 0 | 3 |
| INHA | LZTS1 | 0.683819 | 3 | 0 | 3 |
| INHA | GPR31 | 0.681699 | 4 | 0 | 4 |
| INHA | RIT2 | 0.672383 | 3 | 0 | 3 |
| INHA | TEKT2 | 0.668873 | 3 | 0 | 3 |
| INHA | CT55 | 0.667257 | 3 | 0 | 3 |
| INHA | MED25 | 0.661994 | 3 | 0 | 3 |
| INHA | AGRP | 0.658295 | 5 | 0 | 5 |
| INHA | GUCY2F | 0.657329 | 3 | 0 | 3 |
| INHA | SERPINA6 | 0.651155 | 4 | 0 | 3 |
| INHA | CDK18 | 0.647848 | 3 | 0 | 3 |
| INHA | CLCA1 | 0.645558 | 3 | 0 | 3 |
| INHA | NXPH4 | 0.640941 | 4 | 0 | 3 |
| INHA | KCNA4 | 0.635273 | 4 | 0 | 4 |
| INHA | SERPINF2 | 0.631716 | 4 | 0 | 3 |
| INHA | OBSL1 | 0.62907 | 5 | 0 | 4 |
For details and further investigation, click here