| Full name: integrator complex subunit 3 | Alias Symbol: FLJ21919|INT3|SOSS-A | ||
| Type: protein-coding gene | Cytoband: 1q21.3 | ||
| Entrez ID: 65123 | HGNC ID: HGNC:26153 | Ensembl Gene: ENSG00000143624 | OMIM ID: 611347 |
Screen Evidence:
| |||
Expression of INTS3:
| Dataset | Gene | EntrezID | Probe | Log2FC | Adj.pValue | Expression |
|---|---|---|---|---|---|---|
| GSE17351 | INTS3 | 65123 | 202809_s_at | 0.4000 | 0.3622 | |
| GSE20347 | INTS3 | 65123 | 202809_s_at | 0.3822 | 0.0000 | |
| GSE23400 | INTS3 | 65123 | 202809_s_at | 0.1165 | 0.0725 | |
| GSE26886 | INTS3 | 65123 | 202809_s_at | -0.1202 | 0.4624 | |
| GSE29001 | INTS3 | 65123 | 202809_s_at | 0.2020 | 0.4877 | |
| GSE38129 | INTS3 | 65123 | 202809_s_at | 0.1372 | 0.2458 | |
| GSE45670 | INTS3 | 65123 | 202809_s_at | 0.1688 | 0.2178 | |
| GSE63941 | INTS3 | 65123 | 202809_s_at | 0.9580 | 0.0211 | |
| GSE77861 | INTS3 | 65123 | 202809_s_at | 0.3194 | 0.1198 | |
| GSE97050 | INTS3 | 65123 | A_23_P126757 | 0.0162 | 0.9706 | |
| SRP007169 | INTS3 | 65123 | RNAseq | 0.7966 | 0.0276 | |
| SRP008496 | INTS3 | 65123 | RNAseq | 0.8176 | 0.0013 | |
| SRP064894 | INTS3 | 65123 | RNAseq | 0.3236 | 0.0523 | |
| SRP133303 | INTS3 | 65123 | RNAseq | 0.0351 | 0.8103 | |
| SRP159526 | INTS3 | 65123 | RNAseq | 0.1696 | 0.6104 | |
| SRP193095 | INTS3 | 65123 | RNAseq | 0.3208 | 0.0021 | |
| SRP219564 | INTS3 | 65123 | RNAseq | 0.1517 | 0.6564 | |
| TCGA | INTS3 | 65123 | RNAseq | -0.0545 | 0.2125 |
Upregulated datasets: 0; Downregulated datasets: 0.
Survival by INTS3 expression:
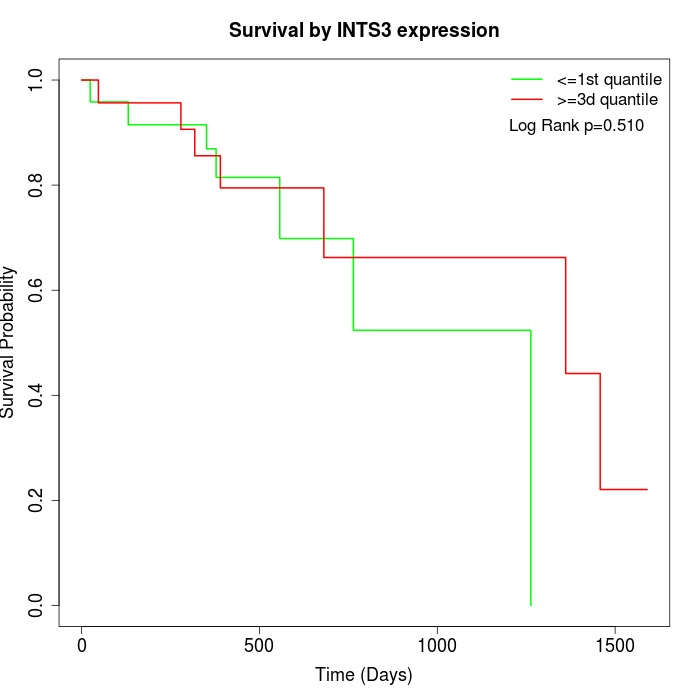 |
| TCGA |
Note: Click image to view full size file.
Copy number change of INTS3:
| Dataset | Gene | EntrezID | Gain | Loss | Normal | Detail |
|---|---|---|---|---|---|---|
| GSE15526 | INTS3 | 65123 | 14 | 0 | 16 | |
| GSE20123 | INTS3 | 65123 | 14 | 0 | 16 | |
| GSE43470 | INTS3 | 65123 | 7 | 2 | 34 | |
| GSE46452 | INTS3 | 65123 | 2 | 1 | 56 | |
| GSE47630 | INTS3 | 65123 | 14 | 0 | 26 | |
| GSE54993 | INTS3 | 65123 | 0 | 4 | 66 | |
| GSE54994 | INTS3 | 65123 | 16 | 0 | 37 | |
| GSE60625 | INTS3 | 65123 | 0 | 0 | 11 | |
| GSE74703 | INTS3 | 65123 | 6 | 1 | 29 | |
| GSE74704 | INTS3 | 65123 | 7 | 0 | 13 | |
| TCGA | INTS3 | 65123 | 38 | 3 | 55 |
Total number of gains: 118; Total number of losses: 11; Total Number of normals: 359.
Somatic mutations of INTS3:
Generating mutation plots.
Highly correlated genes for INTS3:
Showing top 20/751 corelated genes with mean PCC>0.5.
| Gene1 | Gene2 | Mean PCC | Num. Datasets | Num. PCC<0 | Num. PCC>0.5 |
|---|---|---|---|---|---|
| INTS3 | TTC7B | 0.794822 | 3 | 0 | 3 |
| INTS3 | PPP1R35 | 0.788416 | 3 | 0 | 3 |
| INTS3 | TP53I13 | 0.783848 | 3 | 0 | 3 |
| INTS3 | ARL2 | 0.782851 | 3 | 0 | 3 |
| INTS3 | UTP23 | 0.782679 | 3 | 0 | 3 |
| INTS3 | PTK2 | 0.760077 | 4 | 0 | 4 |
| INTS3 | SLC41A1 | 0.758431 | 3 | 0 | 3 |
| INTS3 | AKT1 | 0.755225 | 4 | 0 | 4 |
| INTS3 | RNF130 | 0.75324 | 3 | 0 | 3 |
| INTS3 | PDCD2L | 0.752319 | 3 | 0 | 3 |
| INTS3 | ZNF251 | 0.746879 | 3 | 0 | 3 |
| INTS3 | DARS2 | 0.743084 | 4 | 0 | 4 |
| INTS3 | NAPEPLD | 0.741967 | 3 | 0 | 3 |
| INTS3 | TCF7L1 | 0.740994 | 4 | 0 | 4 |
| INTS3 | XAB2 | 0.734934 | 4 | 0 | 4 |
| INTS3 | SENP5 | 0.734213 | 3 | 0 | 3 |
| INTS3 | METAP1D | 0.733746 | 3 | 0 | 3 |
| INTS3 | FAM50A | 0.730441 | 4 | 0 | 3 |
| INTS3 | ADCY3 | 0.729764 | 5 | 0 | 5 |
| INTS3 | CLASRP | 0.727156 | 5 | 0 | 5 |
For details and further investigation, click here