| Full name: tubulin polymerization promoting protein family member 3 | Alias Symbol: CGI-38|p25gamma|p20 | ||
| Type: protein-coding gene | Cytoband: 16q22.1 | ||
| Entrez ID: 51673 | HGNC ID: HGNC:24162 | Ensembl Gene: ENSG00000159713 | OMIM ID: 616957 |
Expression of TPPP3:
| Dataset | Gene | EntrezID | Probe | Log2FC | Adj.pValue | Expression |
|---|---|---|---|---|---|---|
| GSE17351 | TPPP3 | 51673 | 218876_at | -1.0301 | 0.1369 | |
| GSE20347 | TPPP3 | 51673 | 218876_at | -1.2585 | 0.0056 | |
| GSE23400 | TPPP3 | 51673 | 218876_at | -0.8980 | 0.0000 | |
| GSE26886 | TPPP3 | 51673 | 218876_at | 0.7253 | 0.0828 | |
| GSE29001 | TPPP3 | 51673 | 218876_at | -0.6274 | 0.3904 | |
| GSE38129 | TPPP3 | 51673 | 218876_at | -1.3571 | 0.0002 | |
| GSE45670 | TPPP3 | 51673 | 218876_at | -0.5492 | 0.2387 | |
| GSE53622 | TPPP3 | 51673 | 96823 | -1.2955 | 0.0000 | |
| GSE53624 | TPPP3 | 51673 | 96823 | -1.2084 | 0.0000 | |
| GSE63941 | TPPP3 | 51673 | 218876_at | 0.1979 | 0.7456 | |
| GSE77861 | TPPP3 | 51673 | 218876_at | 1.8356 | 0.0538 | |
| GSE97050 | TPPP3 | 51673 | A_23_P26386 | -0.8666 | 0.2209 | |
| SRP007169 | TPPP3 | 51673 | RNAseq | -0.0520 | 0.9420 | |
| SRP008496 | TPPP3 | 51673 | RNAseq | -0.2388 | 0.7317 | |
| SRP064894 | TPPP3 | 51673 | RNAseq | -0.9016 | 0.0405 | |
| SRP133303 | TPPP3 | 51673 | RNAseq | -1.1789 | 0.0021 | |
| SRP159526 | TPPP3 | 51673 | RNAseq | -0.6179 | 0.3482 | |
| SRP193095 | TPPP3 | 51673 | RNAseq | 0.7405 | 0.0315 | |
| SRP219564 | TPPP3 | 51673 | RNAseq | -0.4809 | 0.5631 | |
| TCGA | TPPP3 | 51673 | RNAseq | -0.3751 | 0.0204 |
Upregulated datasets: 0; Downregulated datasets: 5.
Survival by TPPP3 expression:
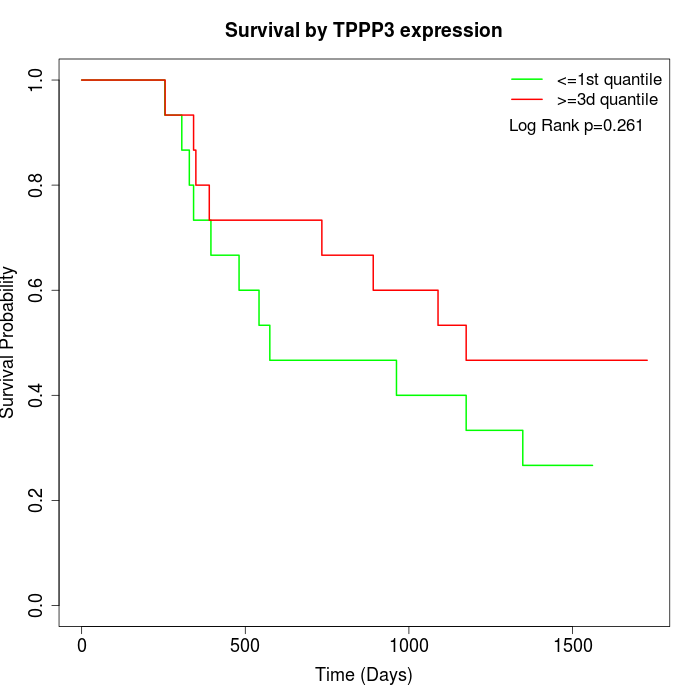 | 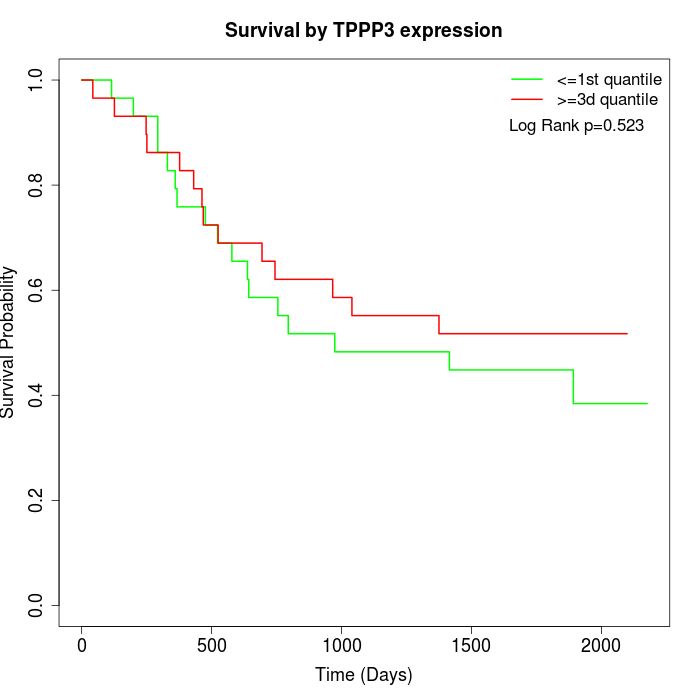 | 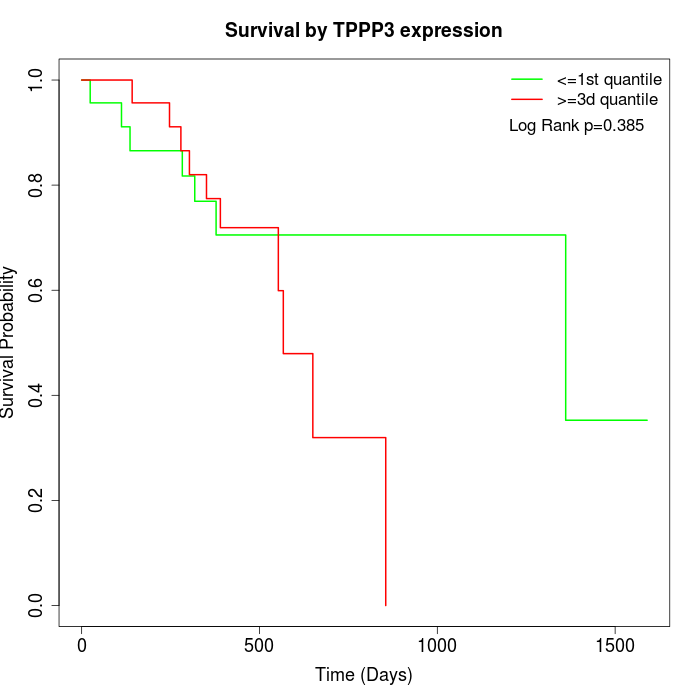 |
| GSE53622 | GSE53624 | TCGA |
Note: Click image to view full size file.
Copy number change of TPPP3:
| Dataset | Gene | EntrezID | Gain | Loss | Normal | Detail |
|---|---|---|---|---|---|---|
| GSE15526 | TPPP3 | 51673 | 9 | 2 | 19 | |
| GSE20123 | TPPP3 | 51673 | 9 | 2 | 19 | |
| GSE43470 | TPPP3 | 51673 | 1 | 9 | 33 | |
| GSE46452 | TPPP3 | 51673 | 38 | 1 | 20 | |
| GSE47630 | TPPP3 | 51673 | 10 | 8 | 22 | |
| GSE54993 | TPPP3 | 51673 | 2 | 4 | 64 | |
| GSE54994 | TPPP3 | 51673 | 8 | 10 | 35 | |
| GSE60625 | TPPP3 | 51673 | 4 | 0 | 7 | |
| GSE74703 | TPPP3 | 51673 | 1 | 6 | 29 | |
| GSE74704 | TPPP3 | 51673 | 5 | 1 | 14 | |
| TCGA | TPPP3 | 51673 | 29 | 12 | 55 |
Total number of gains: 116; Total number of losses: 55; Total Number of normals: 317.
Somatic mutations of TPPP3:
Generating mutation plots.
Highly correlated genes for TPPP3:
Showing top 20/189 corelated genes with mean PCC>0.5.
| Gene1 | Gene2 | Mean PCC | Num. Datasets | Num. PCC<0 | Num. PCC>0.5 |
|---|---|---|---|---|---|
| TPPP3 | MPDZ | 0.783221 | 3 | 0 | 3 |
| TPPP3 | SLC12A2 | 0.771359 | 3 | 0 | 3 |
| TPPP3 | IRS2 | 0.764777 | 3 | 0 | 3 |
| TPPP3 | LRRC49 | 0.759071 | 3 | 0 | 3 |
| TPPP3 | PRKG2 | 0.679648 | 3 | 0 | 3 |
| TPPP3 | CRTC3 | 0.678379 | 3 | 0 | 3 |
| TPPP3 | RBM24 | 0.678087 | 4 | 0 | 4 |
| TPPP3 | KLC2 | 0.676401 | 3 | 0 | 3 |
| TPPP3 | NEGR1 | 0.666222 | 4 | 0 | 3 |
| TPPP3 | RHOQ | 0.658945 | 3 | 0 | 3 |
| TPPP3 | ARPP19 | 0.655276 | 3 | 0 | 3 |
| TPPP3 | PTCHD1 | 0.652687 | 4 | 0 | 3 |
| TPPP3 | CC2D2A | 0.651595 | 4 | 0 | 3 |
| TPPP3 | FXYD1 | 0.651137 | 5 | 0 | 4 |
| TPPP3 | LGI4 | 0.650824 | 4 | 0 | 3 |
| TPPP3 | NRK | 0.642725 | 3 | 0 | 3 |
| TPPP3 | HS1BP3 | 0.640229 | 4 | 0 | 3 |
| TPPP3 | WEE1 | 0.634169 | 5 | 0 | 4 |
| TPPP3 | PLAC9 | 0.633958 | 4 | 0 | 3 |
| TPPP3 | DAAM2 | 0.627281 | 5 | 0 | 4 |
For details and further investigation, click here