| Full name: kelch repeat and BTB domain containing 2 | Alias Symbol: DKFZP566C134 | ||
| Type: protein-coding gene | Cytoband: 7p14.3 | ||
| Entrez ID: 25948 | HGNC ID: HGNC:21751 | Ensembl Gene: ENSG00000170852 | OMIM ID: |
Screen Evidence:
| |||
Expression of KBTBD2:
| Dataset | Gene | EntrezID | Probe | Log2FC | Adj.pValue | Expression |
|---|---|---|---|---|---|---|
| GSE17351 | KBTBD2 | 25948 | 212447_at | 0.2457 | 0.4284 | |
| GSE20347 | KBTBD2 | 25948 | 212447_at | 0.6001 | 0.0000 | |
| GSE23400 | KBTBD2 | 25948 | 212447_at | 0.3369 | 0.0000 | |
| GSE26886 | KBTBD2 | 25948 | 212447_at | 0.4211 | 0.0266 | |
| GSE29001 | KBTBD2 | 25948 | 212447_at | 0.7009 | 0.0093 | |
| GSE38129 | KBTBD2 | 25948 | 212447_at | 0.5924 | 0.0000 | |
| GSE45670 | KBTBD2 | 25948 | 212447_at | 0.1166 | 0.4341 | |
| GSE53622 | KBTBD2 | 25948 | 10338 | 0.5403 | 0.0000 | |
| GSE53624 | KBTBD2 | 25948 | 10338 | 0.3581 | 0.0046 | |
| GSE63941 | KBTBD2 | 25948 | 212447_at | -0.1940 | 0.6821 | |
| GSE77861 | KBTBD2 | 25948 | 212447_at | 0.4270 | 0.1820 | |
| GSE97050 | KBTBD2 | 25948 | A_24_P12539 | 0.3157 | 0.2157 | |
| SRP007169 | KBTBD2 | 25948 | RNAseq | 0.4339 | 0.1568 | |
| SRP008496 | KBTBD2 | 25948 | RNAseq | 0.7878 | 0.0026 | |
| SRP064894 | KBTBD2 | 25948 | RNAseq | 0.2206 | 0.1796 | |
| SRP133303 | KBTBD2 | 25948 | RNAseq | 0.5184 | 0.0004 | |
| SRP159526 | KBTBD2 | 25948 | RNAseq | 0.2692 | 0.2667 | |
| SRP193095 | KBTBD2 | 25948 | RNAseq | 0.3869 | 0.0004 | |
| SRP219564 | KBTBD2 | 25948 | RNAseq | -0.0853 | 0.7602 | |
| TCGA | KBTBD2 | 25948 | RNAseq | 0.1012 | 0.0344 |
Upregulated datasets: 0; Downregulated datasets: 0.
Survival by KBTBD2 expression:
 |  | 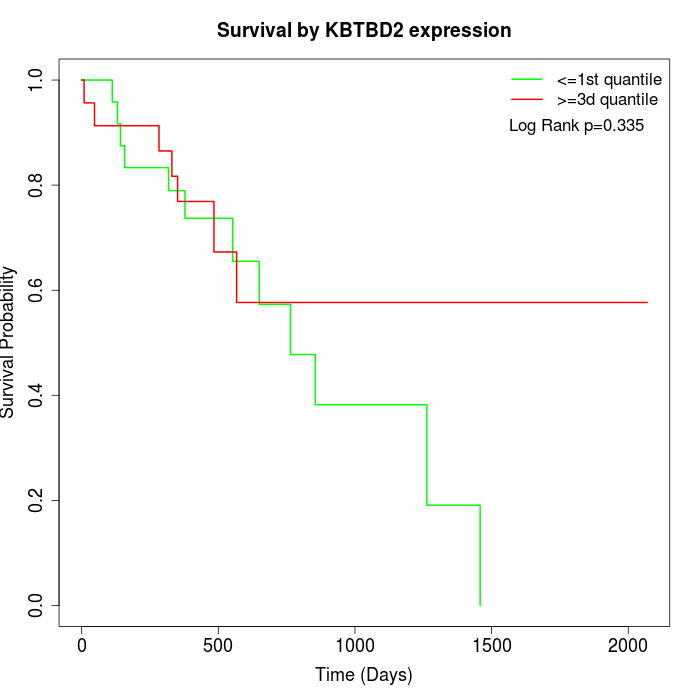 |
| GSE53622 | GSE53624 | TCGA |
Note: Click image to view full size file.
Copy number change of KBTBD2:
| Dataset | Gene | EntrezID | Gain | Loss | Normal | Detail |
|---|---|---|---|---|---|---|
| GSE15526 | KBTBD2 | 25948 | 16 | 0 | 14 | |
| GSE20123 | KBTBD2 | 25948 | 16 | 0 | 14 | |
| GSE43470 | KBTBD2 | 25948 | 4 | 0 | 39 | |
| GSE46452 | KBTBD2 | 25948 | 11 | 1 | 47 | |
| GSE47630 | KBTBD2 | 25948 | 8 | 1 | 31 | |
| GSE54993 | KBTBD2 | 25948 | 0 | 6 | 64 | |
| GSE54994 | KBTBD2 | 25948 | 20 | 2 | 31 | |
| GSE60625 | KBTBD2 | 25948 | 0 | 0 | 11 | |
| GSE74703 | KBTBD2 | 25948 | 4 | 0 | 32 | |
| GSE74704 | KBTBD2 | 25948 | 10 | 0 | 10 | |
| TCGA | KBTBD2 | 25948 | 54 | 6 | 36 |
Total number of gains: 143; Total number of losses: 16; Total Number of normals: 329.
Somatic mutations of KBTBD2:
Generating mutation plots.
Highly correlated genes for KBTBD2:
Showing top 20/1163 corelated genes with mean PCC>0.5.
| Gene1 | Gene2 | Mean PCC | Num. Datasets | Num. PCC<0 | Num. PCC>0.5 |
|---|---|---|---|---|---|
| KBTBD2 | CRIM1 | 0.744784 | 3 | 0 | 3 |
| KBTBD2 | PRICKLE1 | 0.74253 | 3 | 0 | 3 |
| KBTBD2 | NFKBID | 0.740099 | 3 | 0 | 3 |
| KBTBD2 | FHL3 | 0.735187 | 3 | 0 | 3 |
| KBTBD2 | NOM1 | 0.733472 | 3 | 0 | 3 |
| KBTBD2 | CDC26 | 0.732033 | 3 | 0 | 3 |
| KBTBD2 | GLS | 0.729095 | 7 | 0 | 7 |
| KBTBD2 | TMEM176A | 0.720608 | 4 | 0 | 4 |
| KBTBD2 | RIMKLB | 0.714575 | 3 | 0 | 3 |
| KBTBD2 | RICTOR | 0.711996 | 3 | 0 | 3 |
| KBTBD2 | SMCR8 | 0.710352 | 3 | 0 | 3 |
| KBTBD2 | ANAPC4 | 0.710001 | 3 | 0 | 3 |
| KBTBD2 | CISD2 | 0.709289 | 3 | 0 | 3 |
| KBTBD2 | PLXNB3 | 0.706874 | 4 | 0 | 4 |
| KBTBD2 | INTS3 | 0.706048 | 3 | 0 | 3 |
| KBTBD2 | SLC16A2 | 0.703077 | 3 | 0 | 3 |
| KBTBD2 | BRAT1 | 0.700921 | 5 | 0 | 5 |
| KBTBD2 | TRUB1 | 0.698857 | 5 | 0 | 5 |
| KBTBD2 | VEZT | 0.698698 | 3 | 0 | 3 |
| KBTBD2 | GABPB1 | 0.697732 | 6 | 0 | 6 |
For details and further investigation, click here