| Full name: transmembrane protein 176A | Alias Symbol: HCA112|MS4B1 | ||
| Type: protein-coding gene | Cytoband: 7q36.1 | ||
| Entrez ID: 55365 | HGNC ID: HGNC:24930 | Ensembl Gene: ENSG00000002933 | OMIM ID: 610334 |
Expression of TMEM176A:
| Dataset | Gene | EntrezID | Probe | Log2FC | Adj.pValue | Expression |
|---|---|---|---|---|---|---|
| GSE17351 | TMEM176A | 55365 | 218345_at | 0.0296 | 0.9826 | |
| GSE20347 | TMEM176A | 55365 | 218345_at | 0.6887 | 0.0000 | |
| GSE23400 | TMEM176A | 55365 | 218345_at | 0.2214 | 0.0127 | |
| GSE26886 | TMEM176A | 55365 | 218345_at | 0.6406 | 0.1228 | |
| GSE29001 | TMEM176A | 55365 | 218345_at | 0.2928 | 0.3009 | |
| GSE38129 | TMEM176A | 55365 | 218345_at | 0.3119 | 0.3803 | |
| GSE45670 | TMEM176A | 55365 | 218345_at | -0.3209 | 0.1950 | |
| GSE53622 | TMEM176A | 55365 | 81121 | 0.3005 | 0.0392 | |
| GSE53624 | TMEM176A | 55365 | 81121 | 0.3052 | 0.0542 | |
| GSE63941 | TMEM176A | 55365 | 218345_at | -4.0917 | 0.0000 | |
| GSE77861 | TMEM176A | 55365 | 218345_at | 0.3446 | 0.1082 | |
| GSE97050 | TMEM176A | 55365 | A_23_P252082 | 0.8567 | 0.1205 | |
| SRP007169 | TMEM176A | 55365 | RNAseq | 2.3641 | 0.0003 | |
| SRP008496 | TMEM176A | 55365 | RNAseq | 1.7294 | 0.0001 | |
| SRP064894 | TMEM176A | 55365 | RNAseq | 0.5335 | 0.1827 | |
| SRP133303 | TMEM176A | 55365 | RNAseq | 0.5496 | 0.0409 | |
| SRP159526 | TMEM176A | 55365 | RNAseq | 0.3389 | 0.5082 | |
| SRP193095 | TMEM176A | 55365 | RNAseq | 0.8307 | 0.0844 | |
| SRP219564 | TMEM176A | 55365 | RNAseq | 0.9327 | 0.0733 | |
| TCGA | TMEM176A | 55365 | RNAseq | -0.2201 | 0.0611 |
Upregulated datasets: 2; Downregulated datasets: 1.
Survival by TMEM176A expression:
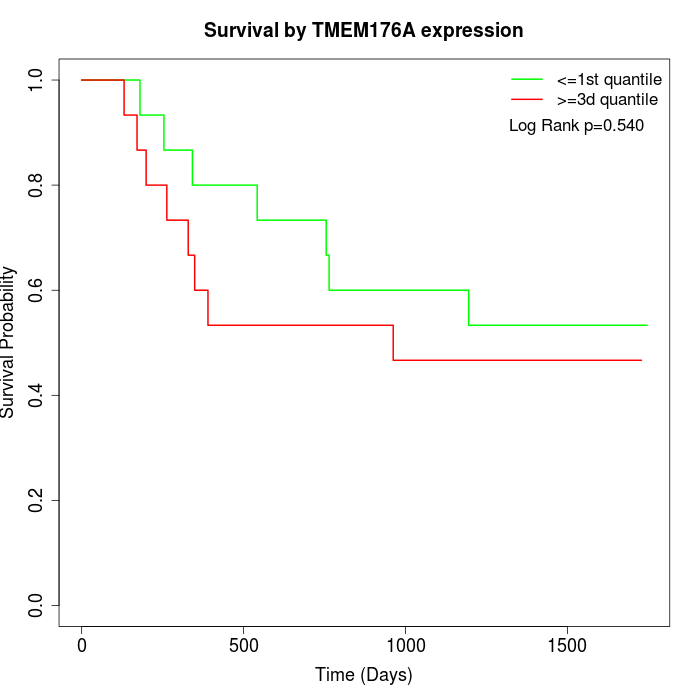 | 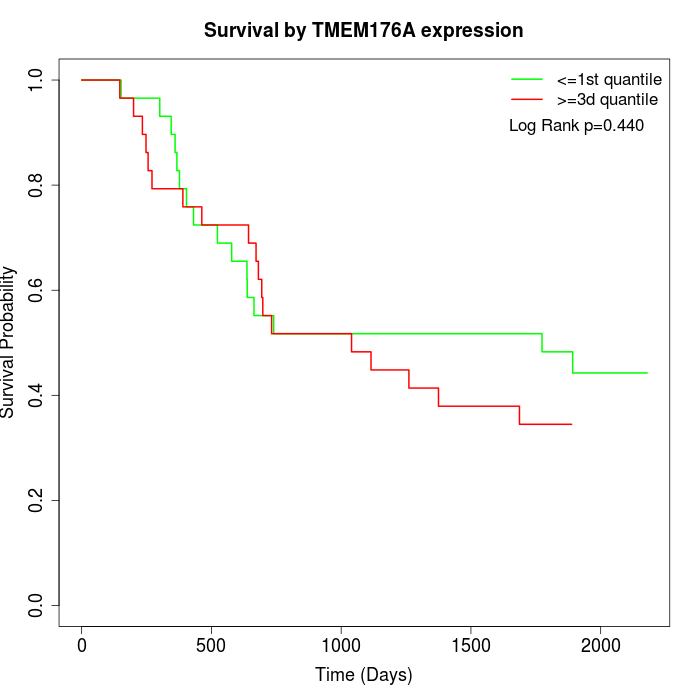 | 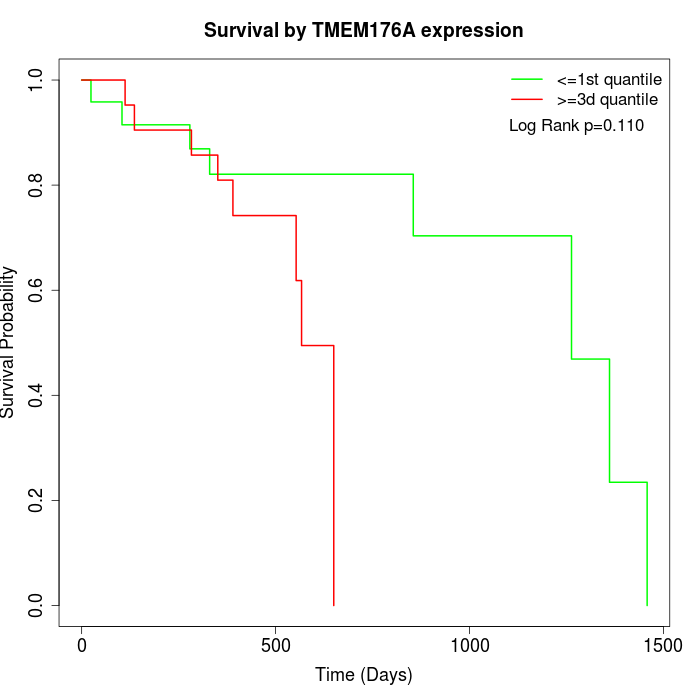 |
| GSE53622 | GSE53624 | TCGA |
Note: Click image to view full size file.
Copy number change of TMEM176A:
| Dataset | Gene | EntrezID | Gain | Loss | Normal | Detail |
|---|---|---|---|---|---|---|
| GSE15526 | TMEM176A | 55365 | 2 | 4 | 24 | |
| GSE20123 | TMEM176A | 55365 | 2 | 4 | 24 | |
| GSE43470 | TMEM176A | 55365 | 2 | 5 | 36 | |
| GSE46452 | TMEM176A | 55365 | 7 | 2 | 50 | |
| GSE47630 | TMEM176A | 55365 | 5 | 9 | 26 | |
| GSE54993 | TMEM176A | 55365 | 3 | 3 | 64 | |
| GSE54994 | TMEM176A | 55365 | 5 | 8 | 40 | |
| GSE60625 | TMEM176A | 55365 | 0 | 0 | 11 | |
| GSE74703 | TMEM176A | 55365 | 2 | 4 | 30 | |
| GSE74704 | TMEM176A | 55365 | 1 | 4 | 15 | |
| TCGA | TMEM176A | 55365 | 26 | 26 | 44 |
Total number of gains: 55; Total number of losses: 69; Total Number of normals: 364.
Somatic mutations of TMEM176A:
Generating mutation plots.
Highly correlated genes for TMEM176A:
Showing top 20/1069 corelated genes with mean PCC>0.5.
| Gene1 | Gene2 | Mean PCC | Num. Datasets | Num. PCC<0 | Num. PCC>0.5 |
|---|---|---|---|---|---|
| TMEM176A | VCAM1 | 0.757651 | 11 | 0 | 11 |
| TMEM176A | C19orf38 | 0.754049 | 3 | 0 | 3 |
| TMEM176A | CERKL | 0.74381 | 3 | 0 | 3 |
| TMEM176A | ICAM1 | 0.732711 | 5 | 0 | 5 |
| TMEM176A | GPC6 | 0.729527 | 6 | 0 | 5 |
| TMEM176A | DEGS1 | 0.727671 | 3 | 0 | 3 |
| TMEM176A | SUCNR1 | 0.725805 | 4 | 0 | 4 |
| TMEM176A | UNC5C | 0.72184 | 5 | 0 | 5 |
| TMEM176A | KBTBD2 | 0.720608 | 4 | 0 | 4 |
| TMEM176A | ITGAM | 0.712231 | 9 | 0 | 8 |
| TMEM176A | SH2B3 | 0.710106 | 13 | 0 | 12 |
| TMEM176A | LAPTM5 | 0.707842 | 10 | 0 | 9 |
| TMEM176A | TRPV2 | 0.706678 | 12 | 0 | 12 |
| TMEM176A | PIK3R6 | 0.706054 | 3 | 0 | 3 |
| TMEM176A | C1orf162 | 0.704601 | 8 | 0 | 7 |
| TMEM176A | PLXNC1 | 0.704025 | 10 | 0 | 9 |
| TMEM176A | TNFRSF1B | 0.702822 | 12 | 0 | 11 |
| TMEM176A | TYROBP | 0.699847 | 11 | 0 | 10 |
| TMEM176A | GBGT1 | 0.699715 | 6 | 0 | 6 |
| TMEM176A | ST8SIA4 | 0.697043 | 5 | 0 | 5 |
For details and further investigation, click here