| Full name: myosin light chain 5 | Alias Symbol: | ||
| Type: protein-coding gene | Cytoband: 4p16.3 | ||
| Entrez ID: 4636 | HGNC ID: HGNC:7586 | Ensembl Gene: ENSG00000215375 | OMIM ID: 160782 |
Screen Evidence:
| |||
MYL5 involved pathways:
| KEGG pathway | Description | View |
|---|---|---|
| hsa04510 | Focal adhesion | |
| hsa04530 | Tight junction | |
| hsa04670 | Leukocyte transendothelial migration | |
| hsa04810 | Regulation of actin cytoskeleton |
Expression of MYL5:
| Dataset | Gene | EntrezID | Probe | Log2FC | Adj.pValue | Expression |
|---|---|---|---|---|---|---|
| GSE17351 | MYL5 | 4636 | 205145_s_at | -0.5652 | 0.1390 | |
| GSE20347 | MYL5 | 4636 | 205145_s_at | -0.9840 | 0.0000 | |
| GSE23400 | MYL5 | 4636 | 205145_s_at | -0.4283 | 0.0000 | |
| GSE26886 | MYL5 | 4636 | 205145_s_at | -0.3909 | 0.0061 | |
| GSE29001 | MYL5 | 4636 | 205145_s_at | -0.7435 | 0.0004 | |
| GSE38129 | MYL5 | 4636 | 205145_s_at | -0.7683 | 0.0000 | |
| GSE45670 | MYL5 | 4636 | 205145_s_at | -0.3657 | 0.0894 | |
| GSE53622 | MYL5 | 4636 | 22162 | -1.6319 | 0.0000 | |
| GSE53624 | MYL5 | 4636 | 22162 | -1.2700 | 0.0000 | |
| GSE63941 | MYL5 | 4636 | 205145_s_at | -1.1322 | 0.0425 | |
| GSE77861 | MYL5 | 4636 | 205145_s_at | -0.4045 | 0.0575 | |
| GSE97050 | MYL5 | 4636 | A_23_P258018 | -1.5311 | 0.1113 | |
| SRP007169 | MYL5 | 4636 | RNAseq | -2.1903 | 0.0000 | |
| SRP064894 | MYL5 | 4636 | RNAseq | -0.0519 | 0.8634 | |
| SRP133303 | MYL5 | 4636 | RNAseq | -0.9821 | 0.0000 | |
| SRP159526 | MYL5 | 4636 | RNAseq | -1.1606 | 0.0000 | |
| SRP193095 | MYL5 | 4636 | RNAseq | -0.7388 | 0.0001 | |
| SRP219564 | MYL5 | 4636 | RNAseq | -0.9218 | 0.0015 | |
| TCGA | MYL5 | 4636 | RNAseq | -0.2420 | 0.0245 |
Upregulated datasets: 0; Downregulated datasets: 5.
Survival by MYL5 expression:
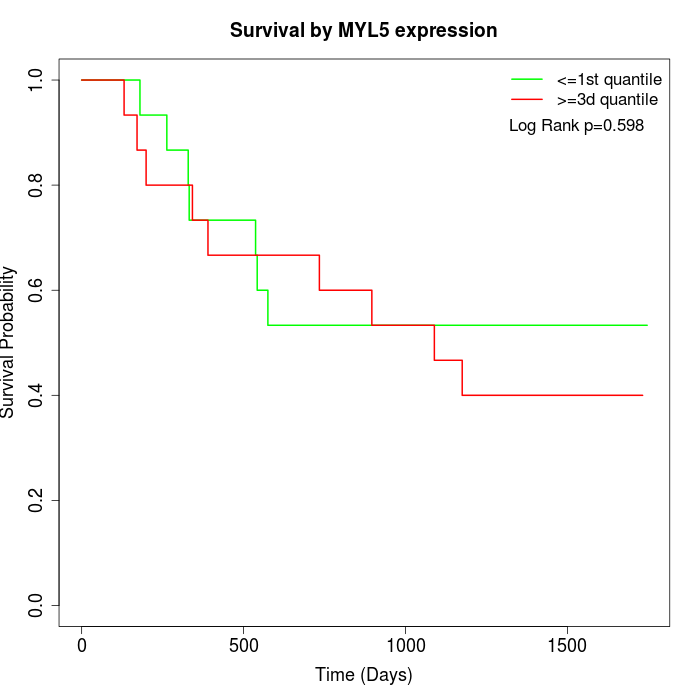 | 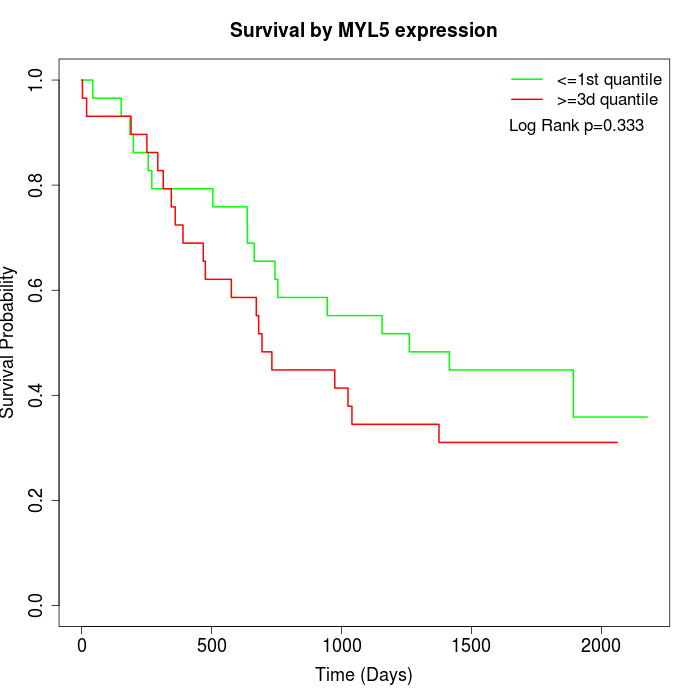 | 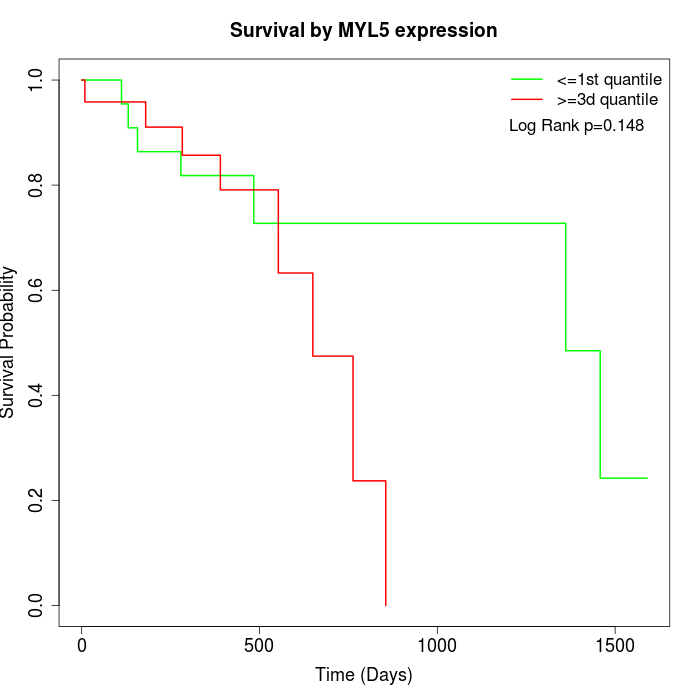 |
| GSE53622 | GSE53624 | TCGA |
Note: Click image to view full size file.
Copy number change of MYL5:
| Dataset | Gene | EntrezID | Gain | Loss | Normal | Detail |
|---|---|---|---|---|---|---|
| GSE15526 | MYL5 | 4636 | 0 | 17 | 13 | |
| GSE20123 | MYL5 | 4636 | 0 | 15 | 15 | |
| GSE43470 | MYL5 | 4636 | 0 | 17 | 26 | |
| GSE46452 | MYL5 | 4636 | 1 | 36 | 22 | |
| GSE47630 | MYL5 | 4636 | 3 | 19 | 18 | |
| GSE54993 | MYL5 | 4636 | 11 | 0 | 59 | |
| GSE54994 | MYL5 | 4636 | 3 | 12 | 38 | |
| GSE60625 | MYL5 | 4636 | 0 | 0 | 11 | |
| GSE74703 | MYL5 | 4636 | 0 | 13 | 23 | |
| GSE74704 | MYL5 | 4636 | 0 | 8 | 12 | |
| TCGA | MYL5 | 4636 | 9 | 47 | 40 |
Total number of gains: 27; Total number of losses: 184; Total Number of normals: 277.
Somatic mutations of MYL5:
Generating mutation plots.
Highly correlated genes for MYL5:
Showing top 20/961 corelated genes with mean PCC>0.5.
| Gene1 | Gene2 | Mean PCC | Num. Datasets | Num. PCC<0 | Num. PCC>0.5 |
|---|---|---|---|---|---|
| MYL5 | MYL9 | 0.872915 | 4 | 0 | 4 |
| MYL5 | ACTBL2 | 0.859608 | 3 | 0 | 3 |
| MYL5 | KCNMB1 | 0.805648 | 3 | 0 | 3 |
| MYL5 | VMAC | 0.792753 | 3 | 0 | 3 |
| MYL5 | PPP1R14A | 0.786206 | 3 | 0 | 3 |
| MYL5 | CYP21A2 | 0.783364 | 3 | 0 | 3 |
| MYL5 | CSRP1 | 0.767241 | 4 | 0 | 3 |
| MYL5 | PLA2G5 | 0.754805 | 3 | 0 | 3 |
| MYL5 | TAGLN | 0.74585 | 4 | 0 | 3 |
| MYL5 | LIMS2 | 0.727775 | 5 | 0 | 4 |
| MYL5 | TNXB | 0.722421 | 4 | 0 | 4 |
| MYL5 | BHMT2 | 0.722332 | 4 | 0 | 4 |
| MYL5 | CPXM2 | 0.72013 | 3 | 0 | 3 |
| MYL5 | RBFOX3 | 0.715805 | 3 | 0 | 3 |
| MYL5 | CTNNA3 | 0.715273 | 4 | 0 | 3 |
| MYL5 | MFAP4 | 0.714664 | 4 | 0 | 4 |
| MYL5 | MEF2C-AS1 | 0.702758 | 4 | 0 | 4 |
| MYL5 | FLNC | 0.701502 | 5 | 0 | 3 |
| MYL5 | CADM2 | 0.700439 | 5 | 0 | 4 |
| MYL5 | DGKB | 0.697492 | 4 | 0 | 4 |
For details and further investigation, click here