| Full name: potassium channel tetramerization domain containing 13 | Alias Symbol: PDIP1|FKSG86|POLDIP1 | ||
| Type: protein-coding gene | Cytoband: 16p11.2 | ||
| Entrez ID: 253980 | HGNC ID: HGNC:22234 | Ensembl Gene: ENSG00000174943 | OMIM ID: 608947 |
Expression of KCTD13:
| Dataset | Gene | EntrezID | Probe | Log2FC | Adj.pValue | Expression |
|---|---|---|---|---|---|---|
| GSE17351 | KCTD13 | 253980 | 45653_at | 0.3142 | 0.4967 | |
| GSE20347 | KCTD13 | 253980 | 45653_at | 0.2372 | 0.2678 | |
| GSE23400 | KCTD13 | 253980 | 45653_at | 0.2039 | 0.0025 | |
| GSE26886 | KCTD13 | 253980 | 45653_at | 0.5936 | 0.0010 | |
| GSE29001 | KCTD13 | 253980 | 221889_at | -0.1270 | 0.5992 | |
| GSE38129 | KCTD13 | 253980 | 221889_at | 0.1162 | 0.4155 | |
| GSE45670 | KCTD13 | 253980 | 45653_at | 0.2855 | 0.0241 | |
| GSE53622 | KCTD13 | 253980 | 126141 | 0.0261 | 0.8644 | |
| GSE53624 | KCTD13 | 253980 | 126141 | 0.2959 | 0.0075 | |
| GSE63941 | KCTD13 | 253980 | 45653_at | 0.8393 | 0.0883 | |
| GSE77861 | KCTD13 | 253980 | 45653_at | 0.2971 | 0.0389 | |
| GSE97050 | KCTD13 | 253980 | A_23_P44849 | 0.1614 | 0.4781 | |
| SRP007169 | KCTD13 | 253980 | RNAseq | 0.3901 | 0.6135 | |
| SRP064894 | KCTD13 | 253980 | RNAseq | 0.5475 | 0.0115 | |
| SRP133303 | KCTD13 | 253980 | RNAseq | 0.5878 | 0.0218 | |
| SRP159526 | KCTD13 | 253980 | RNAseq | 0.4999 | 0.1769 | |
| SRP193095 | KCTD13 | 253980 | RNAseq | 0.4889 | 0.0017 | |
| SRP219564 | KCTD13 | 253980 | RNAseq | 0.4968 | 0.0701 | |
| TCGA | KCTD13 | 253980 | RNAseq | 0.2105 | 0.0032 |
Upregulated datasets: 0; Downregulated datasets: 0.
Survival by KCTD13 expression:
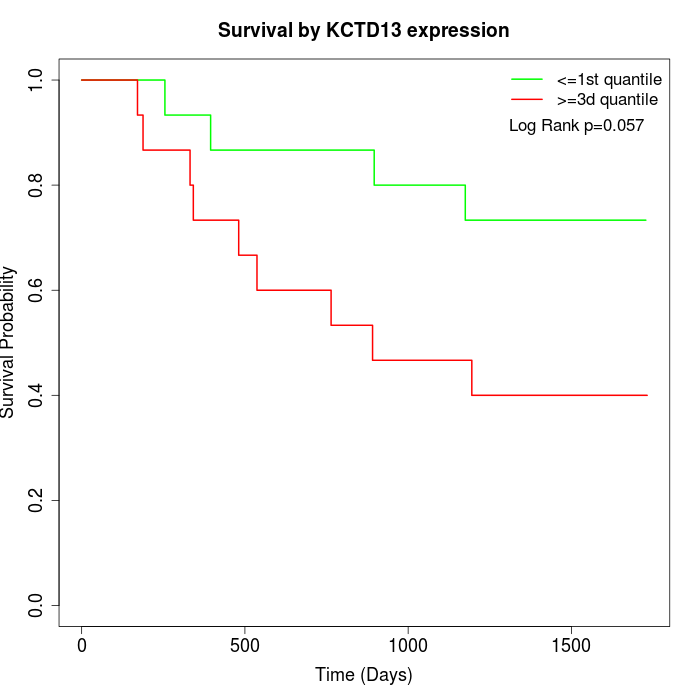 | 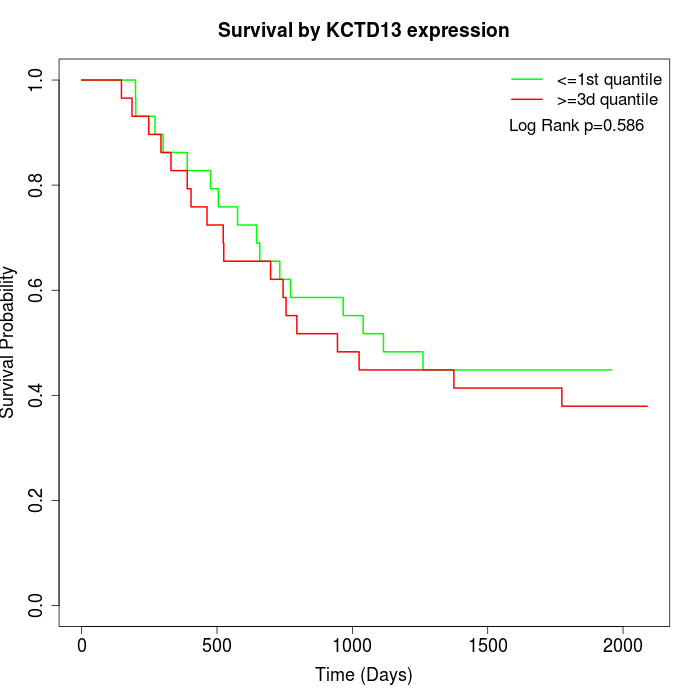 | 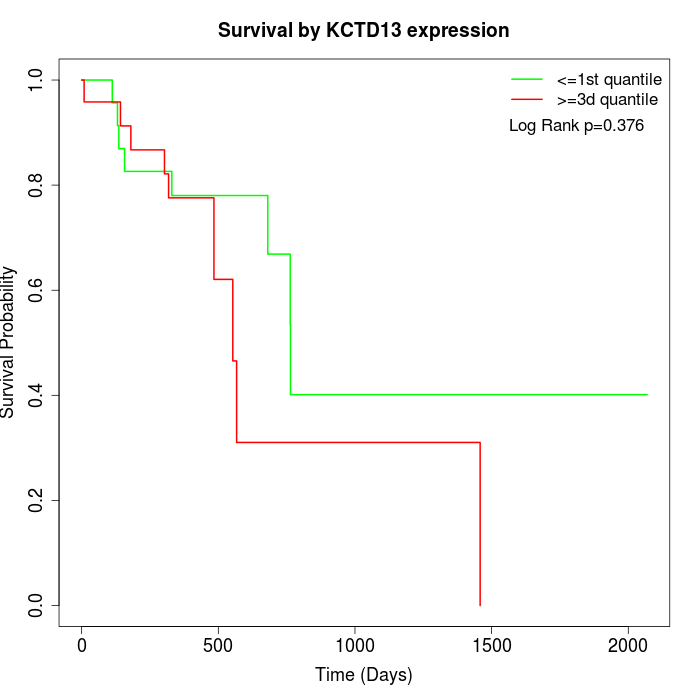 |
| GSE53622 | GSE53624 | TCGA |
Note: Click image to view full size file.
Copy number change of KCTD13:
| Dataset | Gene | EntrezID | Gain | Loss | Normal | Detail |
|---|---|---|---|---|---|---|
| GSE15526 | KCTD13 | 253980 | 5 | 5 | 20 | |
| GSE20123 | KCTD13 | 253980 | 5 | 4 | 21 | |
| GSE43470 | KCTD13 | 253980 | 3 | 3 | 37 | |
| GSE46452 | KCTD13 | 253980 | 38 | 1 | 20 | |
| GSE47630 | KCTD13 | 253980 | 11 | 7 | 22 | |
| GSE54993 | KCTD13 | 253980 | 3 | 5 | 62 | |
| GSE54994 | KCTD13 | 253980 | 5 | 9 | 39 | |
| GSE60625 | KCTD13 | 253980 | 4 | 0 | 7 | |
| GSE74703 | KCTD13 | 253980 | 3 | 2 | 31 | |
| GSE74704 | KCTD13 | 253980 | 3 | 2 | 15 | |
| TCGA | KCTD13 | 253980 | 20 | 11 | 65 |
Total number of gains: 100; Total number of losses: 49; Total Number of normals: 339.
Somatic mutations of KCTD13:
Generating mutation plots.
Highly correlated genes for KCTD13:
Showing top 20/736 corelated genes with mean PCC>0.5.
| Gene1 | Gene2 | Mean PCC | Num. Datasets | Num. PCC<0 | Num. PCC>0.5 |
|---|---|---|---|---|---|
| KCTD13 | PI4KA | 0.795577 | 3 | 0 | 3 |
| KCTD13 | NONO | 0.74537 | 3 | 0 | 3 |
| KCTD13 | CPNE2 | 0.743357 | 3 | 0 | 3 |
| KCTD13 | C11orf24 | 0.741217 | 3 | 0 | 3 |
| KCTD13 | HIP1 | 0.739233 | 3 | 0 | 3 |
| KCTD13 | KLHL13 | 0.737846 | 3 | 0 | 3 |
| KCTD13 | FAT1 | 0.732318 | 3 | 0 | 3 |
| KCTD13 | TMTC4 | 0.732181 | 3 | 0 | 3 |
| KCTD13 | KCNAB2 | 0.731494 | 5 | 0 | 5 |
| KCTD13 | SLC39A14 | 0.730785 | 3 | 0 | 3 |
| KCTD13 | PTGFRN | 0.726777 | 3 | 0 | 3 |
| KCTD13 | PSME3 | 0.72568 | 3 | 0 | 3 |
| KCTD13 | GSTO1 | 0.725291 | 3 | 0 | 3 |
| KCTD13 | ZNF518B | 0.722723 | 3 | 0 | 3 |
| KCTD13 | PFN2 | 0.720097 | 3 | 0 | 3 |
| KCTD13 | ADA | 0.703975 | 3 | 0 | 3 |
| KCTD13 | ITGA5 | 0.703947 | 3 | 0 | 3 |
| KCTD13 | ZBTB22 | 0.702311 | 3 | 0 | 3 |
| KCTD13 | PCBP3 | 0.70188 | 3 | 0 | 3 |
| KCTD13 | PCDH17 | 0.699161 | 3 | 0 | 3 |
For details and further investigation, click here