| Full name: potassium channel tetramerization domain containing 15 | Alias Symbol: MGC25497 | ||
| Type: protein-coding gene | Cytoband: 19q13.11 | ||
| Entrez ID: 79047 | HGNC ID: HGNC:23297 | Ensembl Gene: ENSG00000153885 | OMIM ID: 615240 |
Expression of KCTD15:
| Dataset | Gene | EntrezID | Probe | Log2FC | Adj.pValue | Expression |
|---|---|---|---|---|---|---|
| GSE17351 | KCTD15 | 79047 | 222664_at | 0.4963 | 0.3093 | |
| GSE20347 | KCTD15 | 79047 | 218553_s_at | 0.0382 | 0.8453 | |
| GSE23400 | KCTD15 | 79047 | 218553_s_at | 0.0659 | 0.3004 | |
| GSE26886 | KCTD15 | 79047 | 222668_at | -1.3188 | 0.0001 | |
| GSE29001 | KCTD15 | 79047 | 218553_s_at | 0.2283 | 0.3059 | |
| GSE38129 | KCTD15 | 79047 | 218553_s_at | 0.1073 | 0.4460 | |
| GSE45670 | KCTD15 | 79047 | 222668_at | 0.3891 | 0.0789 | |
| GSE53622 | KCTD15 | 79047 | 28157 | 0.0513 | 0.6375 | |
| GSE53624 | KCTD15 | 79047 | 28157 | 0.0669 | 0.4361 | |
| GSE63941 | KCTD15 | 79047 | 222668_at | -0.1211 | 0.9260 | |
| GSE77861 | KCTD15 | 79047 | 222664_at | 0.0637 | 0.8719 | |
| GSE97050 | KCTD15 | 79047 | A_23_P78871 | -0.1152 | 0.6201 | |
| SRP007169 | KCTD15 | 79047 | RNAseq | 0.0401 | 0.9198 | |
| SRP008496 | KCTD15 | 79047 | RNAseq | 0.4105 | 0.1220 | |
| SRP064894 | KCTD15 | 79047 | RNAseq | 0.5257 | 0.0066 | |
| SRP133303 | KCTD15 | 79047 | RNAseq | -0.0056 | 0.9765 | |
| SRP159526 | KCTD15 | 79047 | RNAseq | 0.3237 | 0.0814 | |
| SRP193095 | KCTD15 | 79047 | RNAseq | 0.0531 | 0.8044 | |
| SRP219564 | KCTD15 | 79047 | RNAseq | -0.6268 | 0.0532 | |
| TCGA | KCTD15 | 79047 | RNAseq | 0.1744 | 0.0059 |
Upregulated datasets: 0; Downregulated datasets: 1.
Survival by KCTD15 expression:
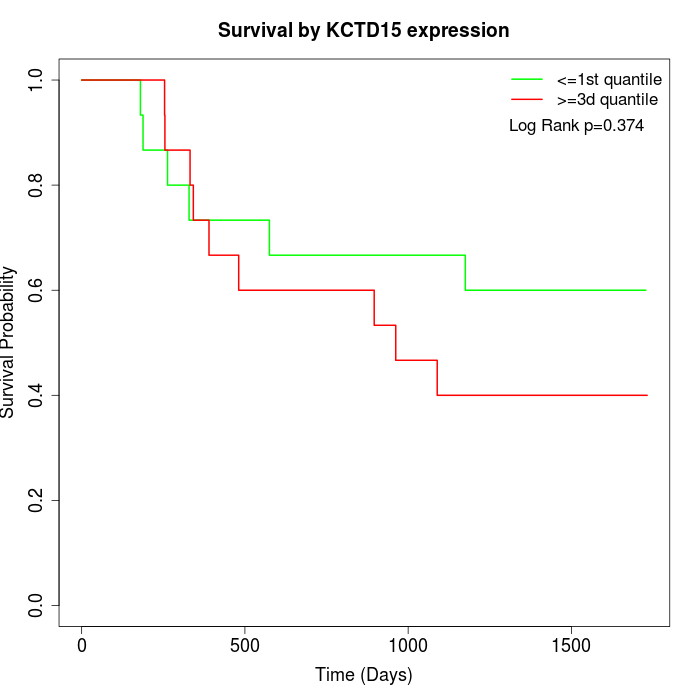 | 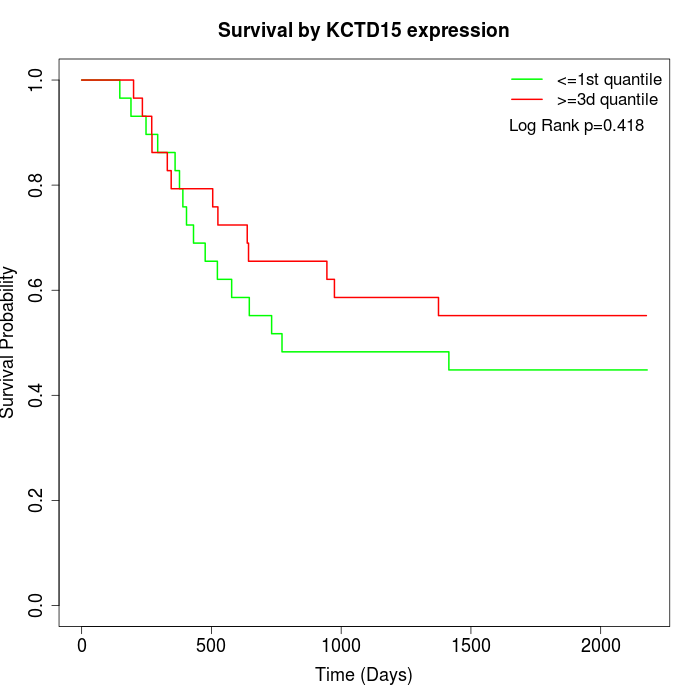 | 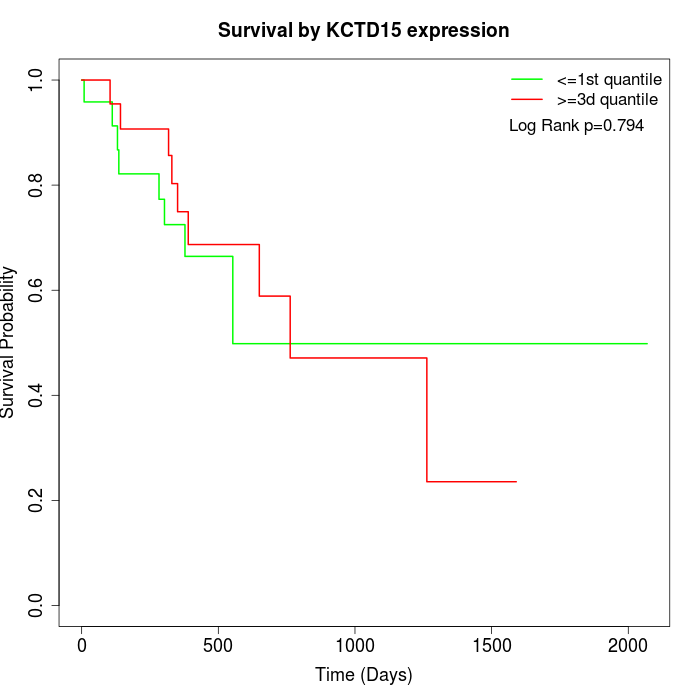 |
| GSE53622 | GSE53624 | TCGA |
Note: Click image to view full size file.
Copy number change of KCTD15:
| Dataset | Gene | EntrezID | Gain | Loss | Normal | Detail |
|---|---|---|---|---|---|---|
| GSE15526 | KCTD15 | 79047 | 6 | 6 | 18 | |
| GSE20123 | KCTD15 | 79047 | 6 | 4 | 20 | |
| GSE43470 | KCTD15 | 79047 | 5 | 6 | 32 | |
| GSE46452 | KCTD15 | 79047 | 48 | 1 | 10 | |
| GSE47630 | KCTD15 | 79047 | 8 | 6 | 26 | |
| GSE54993 | KCTD15 | 79047 | 17 | 3 | 50 | |
| GSE54994 | KCTD15 | 79047 | 8 | 9 | 36 | |
| GSE60625 | KCTD15 | 79047 | 9 | 0 | 2 | |
| GSE74703 | KCTD15 | 79047 | 5 | 4 | 27 | |
| GSE74704 | KCTD15 | 79047 | 6 | 2 | 12 | |
| TCGA | KCTD15 | 79047 | 17 | 12 | 67 |
Total number of gains: 135; Total number of losses: 53; Total Number of normals: 300.
Somatic mutations of KCTD15:
Generating mutation plots.
Highly correlated genes for KCTD15:
Showing top 20/299 corelated genes with mean PCC>0.5.
| Gene1 | Gene2 | Mean PCC | Num. Datasets | Num. PCC<0 | Num. PCC>0.5 |
|---|---|---|---|---|---|
| KCTD15 | LEMD2 | 0.838266 | 3 | 0 | 3 |
| KCTD15 | EI24 | 0.831981 | 3 | 0 | 3 |
| KCTD15 | TBC1D22B | 0.825662 | 3 | 0 | 3 |
| KCTD15 | NIPAL3 | 0.814628 | 3 | 0 | 3 |
| KCTD15 | UPF1 | 0.797861 | 3 | 0 | 3 |
| KCTD15 | IFRD2 | 0.796293 | 3 | 0 | 3 |
| KCTD15 | SPATA2 | 0.786417 | 3 | 0 | 3 |
| KCTD15 | AQR | 0.78486 | 4 | 0 | 4 |
| KCTD15 | C6orf136 | 0.781688 | 3 | 0 | 3 |
| KCTD15 | PNPLA6 | 0.781081 | 3 | 0 | 3 |
| KCTD15 | WDR37 | 0.779966 | 3 | 0 | 3 |
| KCTD15 | MON1A | 0.779514 | 3 | 0 | 3 |
| KCTD15 | ZNF92 | 0.777808 | 3 | 0 | 3 |
| KCTD15 | MTHFR | 0.773538 | 3 | 0 | 3 |
| KCTD15 | ZNF274 | 0.771936 | 3 | 0 | 3 |
| KCTD15 | CYHR1 | 0.770421 | 3 | 0 | 3 |
| KCTD15 | MLLT6 | 0.768761 | 3 | 0 | 3 |
| KCTD15 | SPSB2 | 0.762692 | 3 | 0 | 3 |
| KCTD15 | SRSF10 | 0.760648 | 3 | 0 | 3 |
| KCTD15 | EPS15L1 | 0.760016 | 3 | 0 | 3 |
For details and further investigation, click here