| Full name: potassium channel tetramerization domain containing 9 | Alias Symbol: FLJ20038|BTBD27 | ||
| Type: protein-coding gene | Cytoband: 8p21.2 | ||
| Entrez ID: 54793 | HGNC ID: HGNC:22401 | Ensembl Gene: ENSG00000104756 | OMIM ID: 617265 |
Screen Evidence:
| |||
Expression of KCTD9:
| Dataset | Gene | EntrezID | Probe | Log2FC | Adj.pValue | Expression |
|---|---|---|---|---|---|---|
| GSE17351 | KCTD9 | 54793 | 218823_s_at | -0.6319 | 0.3784 | |
| GSE20347 | KCTD9 | 54793 | 218823_s_at | -0.6113 | 0.0207 | |
| GSE23400 | KCTD9 | 54793 | 218823_s_at | -0.2579 | 0.0351 | |
| GSE26886 | KCTD9 | 54793 | 218823_s_at | -0.8455 | 0.0003 | |
| GSE29001 | KCTD9 | 54793 | 218823_s_at | -0.5360 | 0.1776 | |
| GSE38129 | KCTD9 | 54793 | 218823_s_at | -0.6175 | 0.0005 | |
| GSE45670 | KCTD9 | 54793 | 218823_s_at | -0.2635 | 0.1196 | |
| GSE53622 | KCTD9 | 54793 | 113168 | -0.5695 | 0.0000 | |
| GSE53624 | KCTD9 | 54793 | 113168 | -0.7738 | 0.0000 | |
| GSE63941 | KCTD9 | 54793 | 218823_s_at | -1.2934 | 0.0364 | |
| GSE77861 | KCTD9 | 54793 | 218823_s_at | -0.3260 | 0.2745 | |
| GSE97050 | KCTD9 | 54793 | A_23_P43226 | -0.2169 | 0.2727 | |
| SRP007169 | KCTD9 | 54793 | RNAseq | -0.9301 | 0.0231 | |
| SRP008496 | KCTD9 | 54793 | RNAseq | -0.7953 | 0.0009 | |
| SRP064894 | KCTD9 | 54793 | RNAseq | -0.7466 | 0.0044 | |
| SRP133303 | KCTD9 | 54793 | RNAseq | -0.4865 | 0.0320 | |
| SRP159526 | KCTD9 | 54793 | RNAseq | -0.8330 | 0.0001 | |
| SRP193095 | KCTD9 | 54793 | RNAseq | -0.7070 | 0.0000 | |
| SRP219564 | KCTD9 | 54793 | RNAseq | -0.9941 | 0.0092 | |
| TCGA | KCTD9 | 54793 | RNAseq | 0.0391 | 0.5284 |
Upregulated datasets: 0; Downregulated datasets: 1.
Survival by KCTD9 expression:
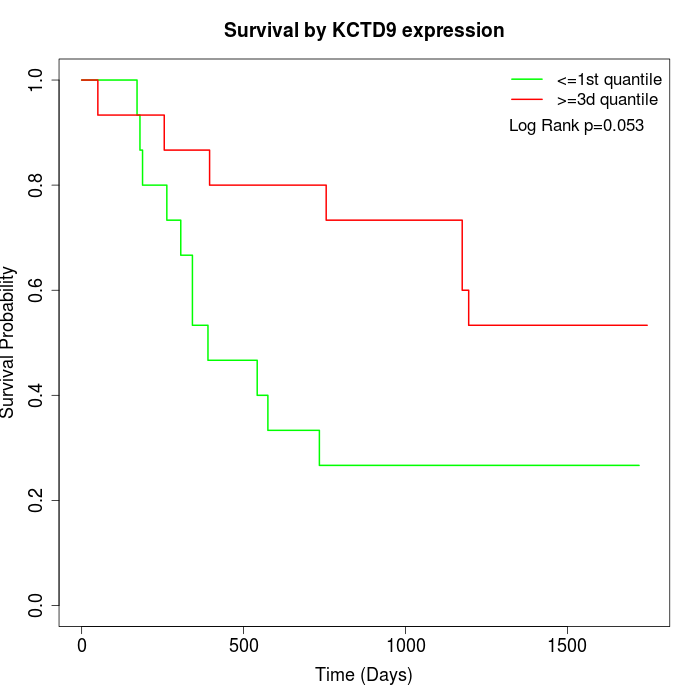 |  |  |
| GSE53622 | GSE53624 | TCGA |
Note: Click image to view full size file.
Copy number change of KCTD9:
| Dataset | Gene | EntrezID | Gain | Loss | Normal | Detail |
|---|---|---|---|---|---|---|
| GSE15526 | KCTD9 | 54793 | 4 | 12 | 14 | |
| GSE20123 | KCTD9 | 54793 | 4 | 12 | 14 | |
| GSE43470 | KCTD9 | 54793 | 4 | 7 | 32 | |
| GSE46452 | KCTD9 | 54793 | 13 | 13 | 33 | |
| GSE47630 | KCTD9 | 54793 | 10 | 8 | 22 | |
| GSE54993 | KCTD9 | 54793 | 2 | 15 | 53 | |
| GSE54994 | KCTD9 | 54793 | 9 | 16 | 28 | |
| GSE60625 | KCTD9 | 54793 | 3 | 0 | 8 | |
| GSE74703 | KCTD9 | 54793 | 4 | 6 | 26 | |
| GSE74704 | KCTD9 | 54793 | 3 | 8 | 9 | |
| TCGA | KCTD9 | 54793 | 15 | 44 | 37 |
Total number of gains: 71; Total number of losses: 141; Total Number of normals: 276.
Somatic mutations of KCTD9:
Generating mutation plots.
Highly correlated genes for KCTD9:
Showing top 20/803 corelated genes with mean PCC>0.5.
| Gene1 | Gene2 | Mean PCC | Num. Datasets | Num. PCC<0 | Num. PCC>0.5 |
|---|---|---|---|---|---|
| KCTD9 | FNIP1 | 0.76061 | 3 | 0 | 3 |
| KCTD9 | NACA2 | 0.735409 | 3 | 0 | 3 |
| KCTD9 | LYSMD3 | 0.7262 | 5 | 0 | 5 |
| KCTD9 | ZNF449 | 0.707485 | 4 | 0 | 4 |
| KCTD9 | KCMF1 | 0.705727 | 3 | 0 | 3 |
| KCTD9 | IQGAP1 | 0.692099 | 6 | 0 | 6 |
| KCTD9 | ARSK | 0.691771 | 3 | 0 | 3 |
| KCTD9 | PPP2CB | 0.691276 | 11 | 0 | 9 |
| KCTD9 | CCNYL1 | 0.689615 | 3 | 0 | 3 |
| KCTD9 | SNRNP27 | 0.686019 | 3 | 0 | 3 |
| KCTD9 | GSKIP | 0.684569 | 4 | 0 | 4 |
| KCTD9 | VPS37A | 0.681644 | 9 | 0 | 8 |
| KCTD9 | ANKRA2 | 0.680697 | 4 | 0 | 3 |
| KCTD9 | SGTB | 0.678091 | 3 | 0 | 3 |
| KCTD9 | PTGS1 | 0.677988 | 5 | 0 | 5 |
| KCTD9 | TADA2B | 0.669237 | 3 | 0 | 3 |
| KCTD9 | AGGF1 | 0.665867 | 4 | 0 | 4 |
| KCTD9 | TMEM106B | 0.664789 | 3 | 0 | 3 |
| KCTD9 | CASC3 | 0.661967 | 3 | 0 | 3 |
| KCTD9 | PPP3CC | 0.659615 | 9 | 0 | 8 |
For details and further investigation, click here