| Full name: prostaglandin-endoperoxide synthase 1 | Alias Symbol: COX1|PGHS-1|PTGHS | ||
| Type: protein-coding gene | Cytoband: 9q33.2 | ||
| Entrez ID: 5742 | HGNC ID: HGNC:9604 | Ensembl Gene: ENSG00000095303 | OMIM ID: 176805 |
| Related drugs: ACETAMINOPHEN, AMINOSALICYLATE POTASSIUM, AMINOSALICYLATE SODIUM, ASPIRIN, BALSALAZID, BALSALAZIDE DISODIUM, BISMUTH SUBSALICYLATE, BROMFENAC, BROMFENAC SODIUM, CHEMBL374385... [more] | |||
PTGS1 involved pathways:
| KEGG pathway | Description | View |
|---|---|---|
| hsa04611 | Platelet activation | |
| hsa04726 | Serotonergic synapse |
Expression of PTGS1:
| Dataset | Gene | EntrezID | Probe | Log2FC | Adj.pValue | Expression |
|---|---|---|---|---|---|---|
| GSE17351 | PTGS1 | 5742 | 205128_x_at | -1.0900 | 0.1438 | |
| GSE20347 | PTGS1 | 5742 | 205128_x_at | -1.3858 | 0.0000 | |
| GSE23400 | PTGS1 | 5742 | 205128_x_at | -0.4150 | 0.0065 | |
| GSE26886 | PTGS1 | 5742 | 205128_x_at | -2.2011 | 0.0000 | |
| GSE29001 | PTGS1 | 5742 | 205128_x_at | -0.9566 | 0.0595 | |
| GSE38129 | PTGS1 | 5742 | 205128_x_at | -1.1822 | 0.0000 | |
| GSE45670 | PTGS1 | 5742 | 205128_x_at | -0.6643 | 0.1201 | |
| GSE53622 | PTGS1 | 5742 | 55688 | -1.7176 | 0.0000 | |
| GSE53624 | PTGS1 | 5742 | 131546 | -2.0097 | 0.0000 | |
| GSE63941 | PTGS1 | 5742 | 205128_x_at | -3.0835 | 0.0496 | |
| GSE77861 | PTGS1 | 5742 | 205128_x_at | -0.6444 | 0.1963 | |
| GSE97050 | PTGS1 | 5742 | A_23_P216966 | -1.0303 | 0.0838 | |
| SRP007169 | PTGS1 | 5742 | RNAseq | -2.2282 | 0.0000 | |
| SRP008496 | PTGS1 | 5742 | RNAseq | -2.2536 | 0.0000 | |
| SRP064894 | PTGS1 | 5742 | RNAseq | -1.0045 | 0.0010 | |
| SRP133303 | PTGS1 | 5742 | RNAseq | -0.8988 | 0.0312 | |
| SRP159526 | PTGS1 | 5742 | RNAseq | -2.2658 | 0.0001 | |
| SRP193095 | PTGS1 | 5742 | RNAseq | -1.0364 | 0.0000 | |
| SRP219564 | PTGS1 | 5742 | RNAseq | -1.1372 | 0.0975 | |
| TCGA | PTGS1 | 5742 | RNAseq | -0.4394 | 0.0029 |
Upregulated datasets: 0; Downregulated datasets: 11.
Survival by PTGS1 expression:
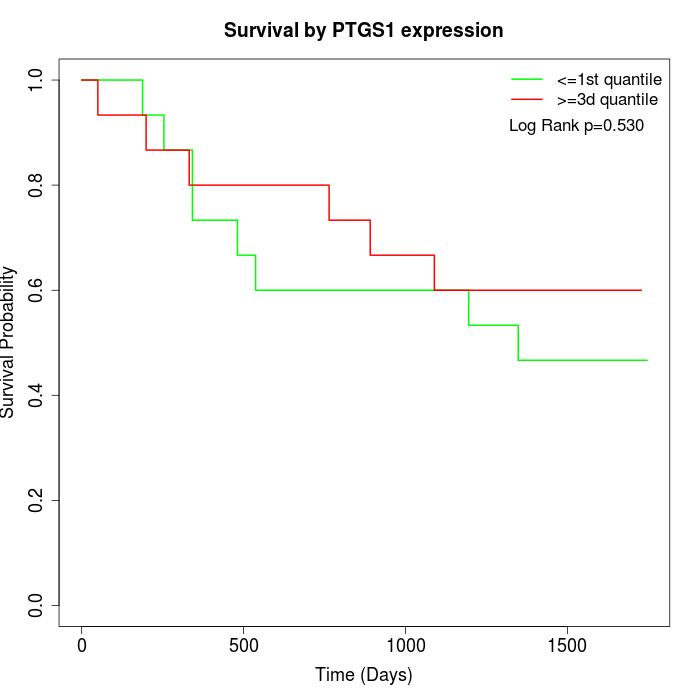 | 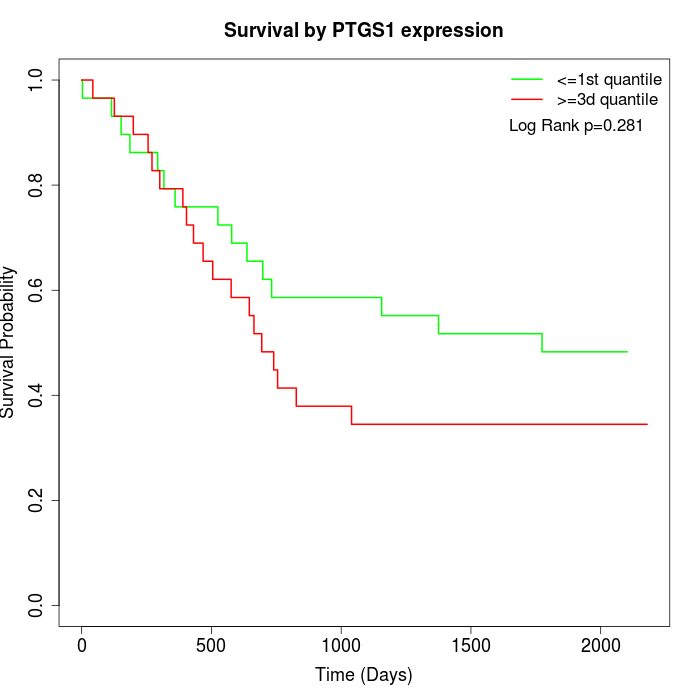 | 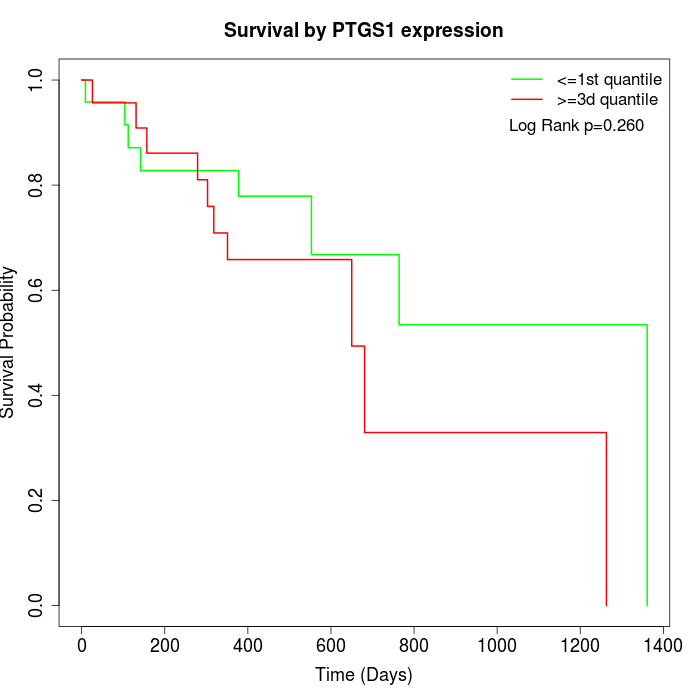 |
| GSE53622 | GSE53624 | TCGA |
Note: Click image to view full size file.
Copy number change of PTGS1:
| Dataset | Gene | EntrezID | Gain | Loss | Normal | Detail |
|---|---|---|---|---|---|---|
| GSE15526 | PTGS1 | 5742 | 3 | 7 | 20 | |
| GSE20123 | PTGS1 | 5742 | 3 | 7 | 20 | |
| GSE43470 | PTGS1 | 5742 | 6 | 3 | 34 | |
| GSE46452 | PTGS1 | 5742 | 6 | 13 | 40 | |
| GSE47630 | PTGS1 | 5742 | 3 | 16 | 21 | |
| GSE54993 | PTGS1 | 5742 | 3 | 3 | 64 | |
| GSE54994 | PTGS1 | 5742 | 9 | 10 | 34 | |
| GSE60625 | PTGS1 | 5742 | 0 | 0 | 11 | |
| GSE74703 | PTGS1 | 5742 | 5 | 3 | 28 | |
| GSE74704 | PTGS1 | 5742 | 2 | 5 | 13 | |
| TCGA | PTGS1 | 5742 | 27 | 24 | 45 |
Total number of gains: 67; Total number of losses: 91; Total Number of normals: 330.
Somatic mutations of PTGS1:
Generating mutation plots.
Highly correlated genes for PTGS1:
Showing top 20/1132 corelated genes with mean PCC>0.5.
| Gene1 | Gene2 | Mean PCC | Num. Datasets | Num. PCC<0 | Num. PCC>0.5 |
|---|---|---|---|---|---|
| PTGS1 | KCNB1 | 0.756855 | 3 | 0 | 3 |
| PTGS1 | SLITRK3 | 0.754728 | 3 | 0 | 3 |
| PTGS1 | NDUFB8 | 0.739448 | 4 | 0 | 4 |
| PTGS1 | HSPB6 | 0.737838 | 3 | 0 | 3 |
| PTGS1 | SORBS1 | 0.719105 | 3 | 0 | 3 |
| PTGS1 | RNASE4 | 0.709847 | 3 | 0 | 3 |
| PTGS1 | NKIRAS1 | 0.709455 | 4 | 0 | 4 |
| PTGS1 | TMUB2 | 0.708391 | 3 | 0 | 3 |
| PTGS1 | PITHD1 | 0.707729 | 6 | 0 | 6 |
| PTGS1 | ANKRA2 | 0.70696 | 4 | 0 | 3 |
| PTGS1 | FRMD3 | 0.702717 | 3 | 0 | 3 |
| PTGS1 | HIPK3 | 0.702053 | 5 | 0 | 4 |
| PTGS1 | UBQLN1 | 0.700613 | 3 | 0 | 3 |
| PTGS1 | PDZRN4 | 0.699015 | 3 | 0 | 3 |
| PTGS1 | RBPMS2 | 0.697546 | 3 | 0 | 3 |
| PTGS1 | BNC2 | 0.690495 | 4 | 0 | 3 |
| PTGS1 | UQCRC2 | 0.689109 | 4 | 0 | 4 |
| PTGS1 | MRPS36 | 0.685724 | 5 | 0 | 4 |
| PTGS1 | PCSK2 | 0.683517 | 3 | 0 | 3 |
| PTGS1 | KCNMB1 | 0.682428 | 3 | 0 | 3 |
For details and further investigation, click here