| Full name: folliculin interacting protein 1 | Alias Symbol: KIAA1961 | ||
| Type: protein-coding gene | Cytoband: 5q31.1 | ||
| Entrez ID: 96459 | HGNC ID: HGNC:29418 | Ensembl Gene: ENSG00000217128 | OMIM ID: 610594 |
FNIP1 involved pathways:
| KEGG pathway | Description | View |
|---|---|---|
| hsa04150 | mTOR signaling pathway |
Expression of FNIP1:
| Dataset | Gene | EntrezID | Probe | Log2FC | Adj.pValue | Expression |
|---|---|---|---|---|---|---|
| GSE17351 | FNIP1 | 96459 | 228768_at | -0.2151 | 0.5437 | |
| GSE26886 | FNIP1 | 96459 | 228768_at | 0.2967 | 0.0970 | |
| GSE45670 | FNIP1 | 96459 | 228768_at | -0.2727 | 0.0590 | |
| GSE53622 | FNIP1 | 96459 | 134863 | 0.0438 | 0.6262 | |
| GSE53624 | FNIP1 | 96459 | 134863 | 0.3467 | 0.0000 | |
| GSE63941 | FNIP1 | 96459 | 228768_at | -1.3006 | 0.0020 | |
| GSE77861 | FNIP1 | 96459 | 228768_at | 0.2123 | 0.4156 | |
| GSE97050 | FNIP1 | 96459 | A_33_P3805085 | -0.2028 | 0.3960 | |
| SRP007169 | FNIP1 | 96459 | RNAseq | -0.1200 | 0.6912 | |
| SRP008496 | FNIP1 | 96459 | RNAseq | -0.1104 | 0.5245 | |
| SRP064894 | FNIP1 | 96459 | RNAseq | 0.1347 | 0.5357 | |
| SRP133303 | FNIP1 | 96459 | RNAseq | 0.2604 | 0.1732 | |
| SRP159526 | FNIP1 | 96459 | RNAseq | -0.3066 | 0.1242 | |
| SRP193095 | FNIP1 | 96459 | RNAseq | -0.1219 | 0.2121 | |
| SRP219564 | FNIP1 | 96459 | RNAseq | 0.0959 | 0.7902 | |
| TCGA | FNIP1 | 96459 | RNAseq | -0.1471 | 0.0187 |
Upregulated datasets: 0; Downregulated datasets: 1.
Survival by FNIP1 expression:
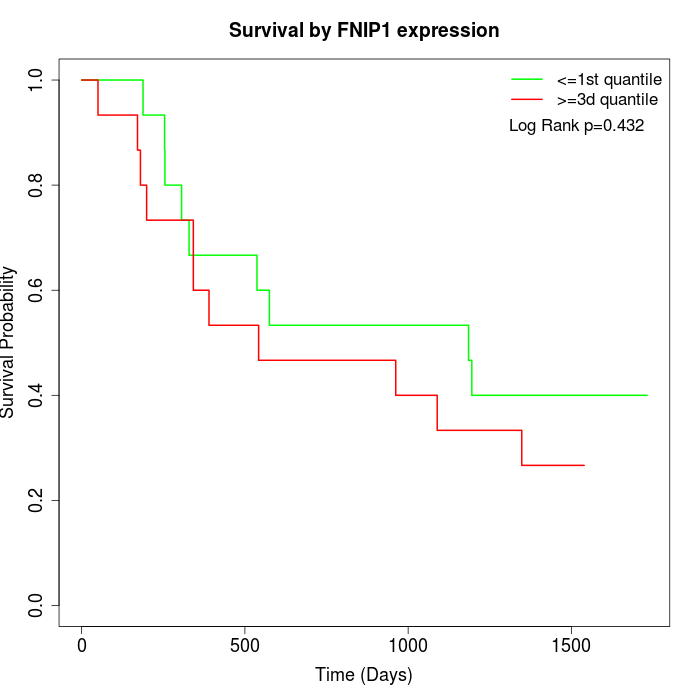 | 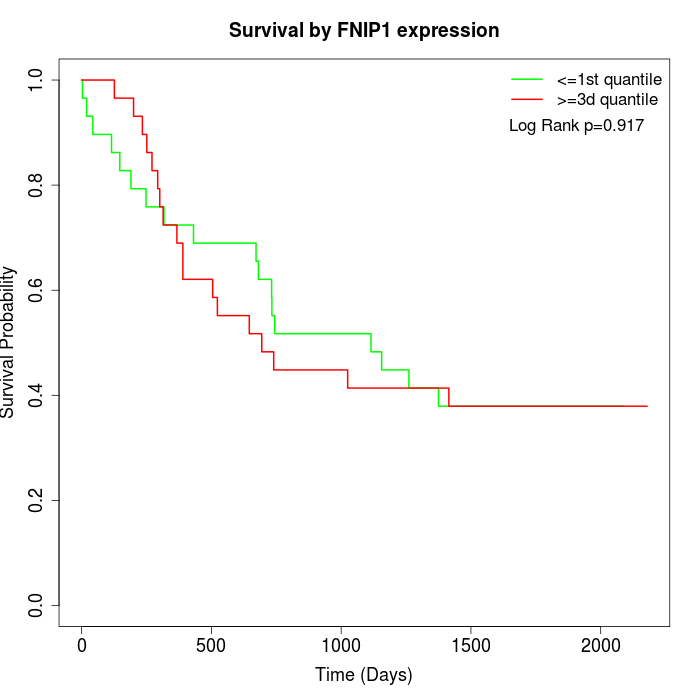 | 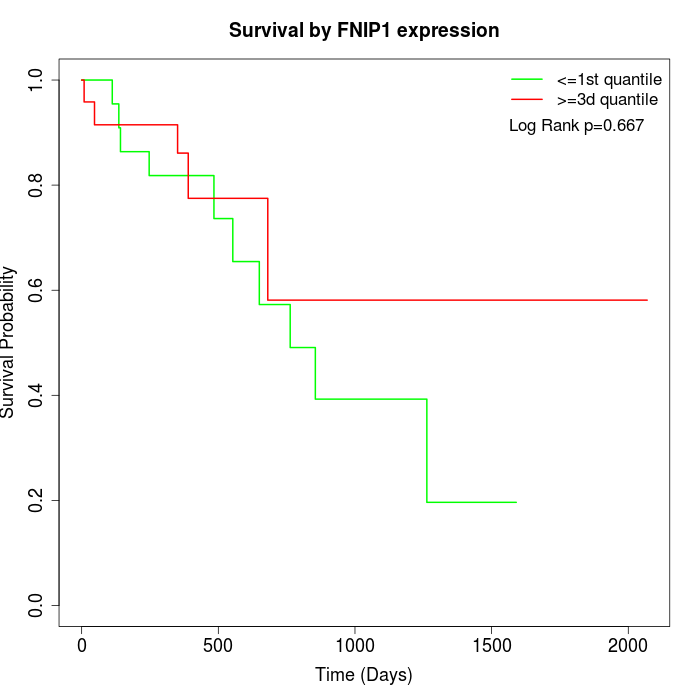 |
| GSE53622 | GSE53624 | TCGA |
Note: Click image to view full size file.
Copy number change of FNIP1:
| Dataset | Gene | EntrezID | Gain | Loss | Normal | Detail |
|---|---|---|---|---|---|---|
| GSE15526 | FNIP1 | 96459 | 1 | 12 | 17 | |
| GSE20123 | FNIP1 | 96459 | 1 | 12 | 17 | |
| GSE43470 | FNIP1 | 96459 | 2 | 9 | 32 | |
| GSE46452 | FNIP1 | 96459 | 0 | 27 | 32 | |
| GSE47630 | FNIP1 | 96459 | 0 | 21 | 19 | |
| GSE54993 | FNIP1 | 96459 | 9 | 1 | 60 | |
| GSE54994 | FNIP1 | 96459 | 1 | 15 | 37 | |
| GSE60625 | FNIP1 | 96459 | 0 | 0 | 11 | |
| GSE74703 | FNIP1 | 96459 | 2 | 6 | 28 | |
| GSE74704 | FNIP1 | 96459 | 1 | 6 | 13 | |
| TCGA | FNIP1 | 96459 | 4 | 40 | 52 |
Total number of gains: 21; Total number of losses: 149; Total Number of normals: 318.
Somatic mutations of FNIP1:
Generating mutation plots.
Highly correlated genes for FNIP1:
Showing top 20/449 corelated genes with mean PCC>0.5.
| Gene1 | Gene2 | Mean PCC | Num. Datasets | Num. PCC<0 | Num. PCC>0.5 |
|---|---|---|---|---|---|
| FNIP1 | CNOT4 | 0.805704 | 3 | 0 | 3 |
| FNIP1 | TBC1D20 | 0.763944 | 3 | 0 | 3 |
| FNIP1 | PCSK5 | 0.762673 | 3 | 0 | 3 |
| FNIP1 | KCTD9 | 0.76061 | 3 | 0 | 3 |
| FNIP1 | FOXN3 | 0.757314 | 3 | 0 | 3 |
| FNIP1 | AK3 | 0.753989 | 3 | 0 | 3 |
| FNIP1 | IFT74 | 0.752269 | 3 | 0 | 3 |
| FNIP1 | CEP44 | 0.752233 | 4 | 0 | 3 |
| FNIP1 | GNG12 | 0.751973 | 4 | 0 | 3 |
| FNIP1 | ZFP90 | 0.749417 | 3 | 0 | 3 |
| FNIP1 | RBM22 | 0.746486 | 5 | 0 | 4 |
| FNIP1 | SGMS1 | 0.742226 | 3 | 0 | 3 |
| FNIP1 | HARS2 | 0.741945 | 3 | 0 | 3 |
| FNIP1 | FAM126A | 0.739881 | 3 | 0 | 3 |
| FNIP1 | OPTN | 0.739752 | 3 | 0 | 3 |
| FNIP1 | USP33 | 0.737363 | 3 | 0 | 3 |
| FNIP1 | SLC35E3 | 0.7363 | 3 | 0 | 3 |
| FNIP1 | IBTK | 0.735308 | 3 | 0 | 3 |
| FNIP1 | ENTPD4 | 0.732813 | 3 | 0 | 3 |
| FNIP1 | DHX29 | 0.731759 | 4 | 0 | 3 |
For details and further investigation, click here