| Full name: nascent polypeptide associated complex subunit alpha 2 | Alias Symbol: MGC71999 | ||
| Type: protein-coding gene | Cytoband: 17q23.3 | ||
| Entrez ID: 342538 | HGNC ID: HGNC:23290 | Ensembl Gene: ENSG00000253506 | OMIM ID: 609274 |
Expression of NACA2:
| Dataset | Gene | EntrezID | Probe | Log2FC | Adj.pValue | Expression |
|---|---|---|---|---|---|---|
| GSE17351 | NACA2 | 342538 | 222224_at | -0.0512 | 0.8628 | |
| GSE20347 | NACA2 | 342538 | 222224_at | -0.0438 | 0.4942 | |
| GSE23400 | NACA2 | 342538 | 222224_at | -0.0189 | 0.1797 | |
| GSE26886 | NACA2 | 342538 | 222224_at | -0.0205 | 0.8676 | |
| GSE29001 | NACA2 | 342538 | 222224_at | -0.0362 | 0.6789 | |
| GSE38129 | NACA2 | 342538 | 222224_at | -0.0416 | 0.4211 | |
| GSE45670 | NACA2 | 342538 | 222224_at | -0.2064 | 0.0048 | |
| GSE53622 | NACA2 | 342538 | 51734 | -0.5703 | 0.0000 | |
| GSE53624 | NACA2 | 342538 | 51734 | -0.4580 | 0.0000 | |
| GSE63941 | NACA2 | 342538 | 222224_at | 0.0682 | 0.6193 | |
| GSE77861 | NACA2 | 342538 | 222224_at | -0.1790 | 0.0997 | |
| GSE97050 | NACA2 | 342538 | A_32_P141923 | -0.5181 | 0.1113 | |
| TCGA | NACA2 | 342538 | RNAseq | 0.0808 | 0.6769 |
Upregulated datasets: 0; Downregulated datasets: 0.
Survival by NACA2 expression:
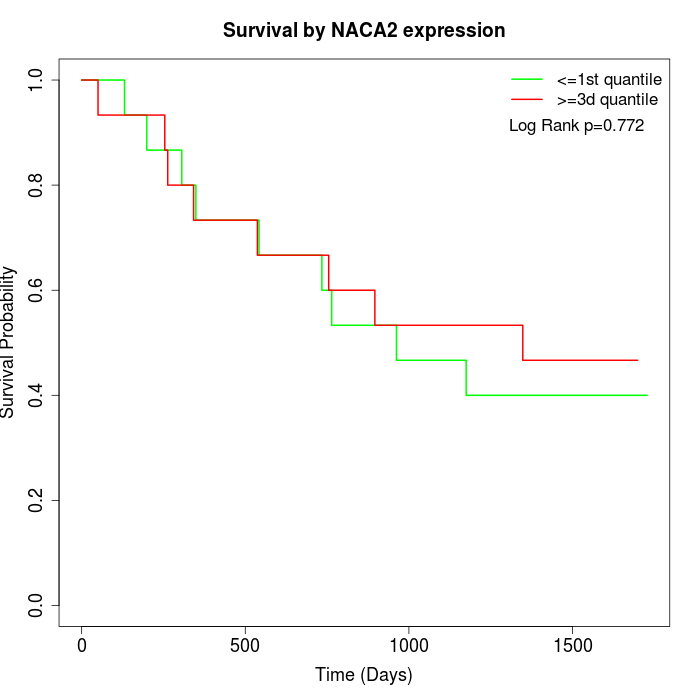 | 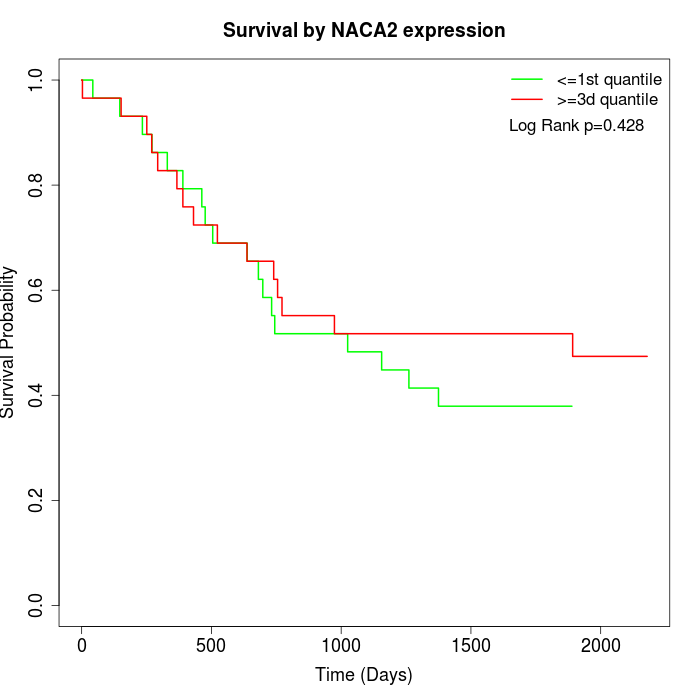 | 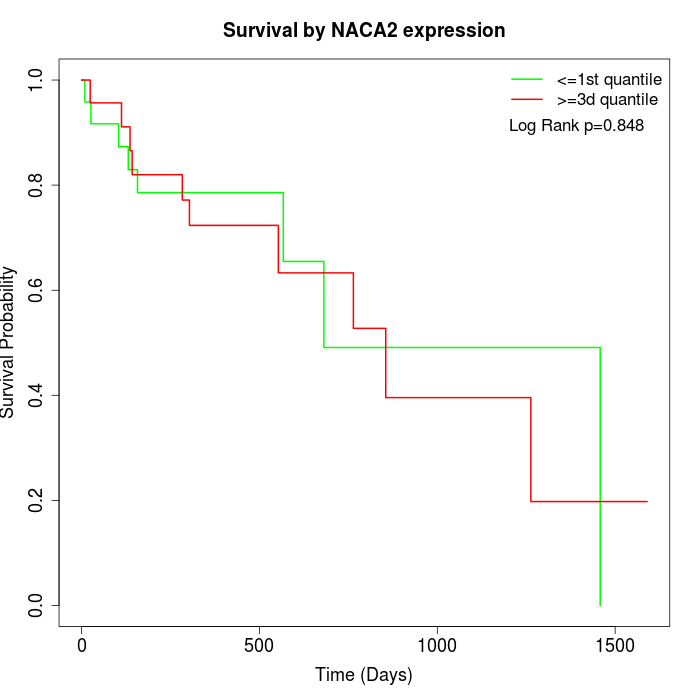 |
| GSE53622 | GSE53624 | TCGA |
Note: Click image to view full size file.
Copy number change of NACA2:
| Dataset | Gene | EntrezID | Gain | Loss | Normal | Detail |
|---|---|---|---|---|---|---|
| GSE15526 | NACA2 | 342538 | 4 | 1 | 25 | |
| GSE20123 | NACA2 | 342538 | 4 | 1 | 25 | |
| GSE43470 | NACA2 | 342538 | 5 | 0 | 38 | |
| GSE46452 | NACA2 | 342538 | 32 | 0 | 27 | |
| GSE47630 | NACA2 | 342538 | 7 | 1 | 32 | |
| GSE54993 | NACA2 | 342538 | 2 | 5 | 63 | |
| GSE54994 | NACA2 | 342538 | 9 | 5 | 39 | |
| GSE60625 | NACA2 | 342538 | 4 | 0 | 7 | |
| GSE74703 | NACA2 | 342538 | 5 | 0 | 31 | |
| GSE74704 | NACA2 | 342538 | 3 | 1 | 16 | |
| TCGA | NACA2 | 342538 | 31 | 6 | 59 |
Total number of gains: 106; Total number of losses: 20; Total Number of normals: 362.
Somatic mutations of NACA2:
Generating mutation plots.
Highly correlated genes for NACA2:
Showing top 20/401 corelated genes with mean PCC>0.5.
| Gene1 | Gene2 | Mean PCC | Num. Datasets | Num. PCC<0 | Num. PCC>0.5 |
|---|---|---|---|---|---|
| NACA2 | USP54 | 0.800726 | 3 | 0 | 3 |
| NACA2 | SRSF8 | 0.762404 | 3 | 0 | 3 |
| NACA2 | SRP14 | 0.759332 | 3 | 0 | 3 |
| NACA2 | RAB27A | 0.758973 | 3 | 0 | 3 |
| NACA2 | KCTD9 | 0.735409 | 3 | 0 | 3 |
| NACA2 | ARFIP1 | 0.726859 | 3 | 0 | 3 |
| NACA2 | REXO2 | 0.722218 | 3 | 0 | 3 |
| NACA2 | NDUFA7 | 0.720159 | 3 | 0 | 3 |
| NACA2 | UBE2J1 | 0.714731 | 3 | 0 | 3 |
| NACA2 | CIRBP | 0.709147 | 3 | 0 | 3 |
| NACA2 | ZFAND6 | 0.706722 | 3 | 0 | 3 |
| NACA2 | USP6NL | 0.705739 | 4 | 0 | 3 |
| NACA2 | RNF135 | 0.70385 | 3 | 0 | 3 |
| NACA2 | CGNL1 | 0.699338 | 3 | 0 | 3 |
| NACA2 | EPB41L3 | 0.698244 | 3 | 0 | 3 |
| NACA2 | PIAS1 | 0.697887 | 3 | 0 | 3 |
| NACA2 | EDF1 | 0.697004 | 4 | 0 | 3 |
| NACA2 | EIF3L | 0.696489 | 3 | 0 | 3 |
| NACA2 | PITHD1 | 0.695956 | 3 | 0 | 3 |
| NACA2 | FCHO2 | 0.69566 | 3 | 0 | 3 |
For details and further investigation, click here