| Full name: kelch like family member 20 | Alias Symbol: KLEIP|KHLHX | ||
| Type: protein-coding gene | Cytoband: 1q25.1 | ||
| Entrez ID: 27252 | HGNC ID: HGNC:25056 | Ensembl Gene: ENSG00000076321 | OMIM ID: 617679 |
Expression of KLHL20:
| Dataset | Gene | EntrezID | Probe | Log2FC | Adj.pValue | Expression |
|---|---|---|---|---|---|---|
| GSE17351 | KLHL20 | 27252 | 204177_s_at | 0.0004 | 0.9994 | |
| GSE20347 | KLHL20 | 27252 | 204177_s_at | 0.1210 | 0.2230 | |
| GSE23400 | KLHL20 | 27252 | 210635_s_at | -0.0550 | 0.1197 | |
| GSE26886 | KLHL20 | 27252 | 204177_s_at | -0.8103 | 0.0000 | |
| GSE29001 | KLHL20 | 27252 | 204177_s_at | 0.2294 | 0.2796 | |
| GSE38129 | KLHL20 | 27252 | 204177_s_at | 0.0279 | 0.8027 | |
| GSE45670 | KLHL20 | 27252 | 204177_s_at | -0.1485 | 0.1140 | |
| GSE53622 | KLHL20 | 27252 | 62721 | -0.3645 | 0.0000 | |
| GSE53624 | KLHL20 | 27252 | 62721 | -0.3267 | 0.0003 | |
| GSE63941 | KLHL20 | 27252 | 204176_at | -1.6042 | 0.0010 | |
| GSE77861 | KLHL20 | 27252 | 204177_s_at | 0.2326 | 0.1775 | |
| GSE97050 | KLHL20 | 27252 | A_33_P3243707 | -0.0366 | 0.8840 | |
| SRP007169 | KLHL20 | 27252 | RNAseq | 0.4811 | 0.2991 | |
| SRP008496 | KLHL20 | 27252 | RNAseq | 0.6021 | 0.0800 | |
| SRP064894 | KLHL20 | 27252 | RNAseq | -0.0123 | 0.9607 | |
| SRP133303 | KLHL20 | 27252 | RNAseq | 0.1187 | 0.1962 | |
| SRP159526 | KLHL20 | 27252 | RNAseq | 0.1047 | 0.7475 | |
| SRP193095 | KLHL20 | 27252 | RNAseq | -0.1261 | 0.1668 | |
| SRP219564 | KLHL20 | 27252 | RNAseq | 0.0524 | 0.8619 | |
| TCGA | KLHL20 | 27252 | RNAseq | -0.0180 | 0.7417 |
Upregulated datasets: 0; Downregulated datasets: 1.
Survival by KLHL20 expression:
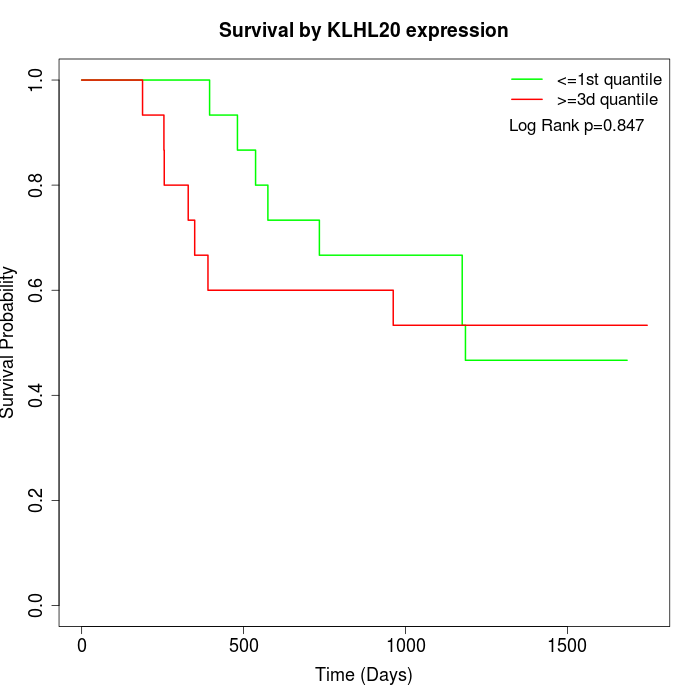 | 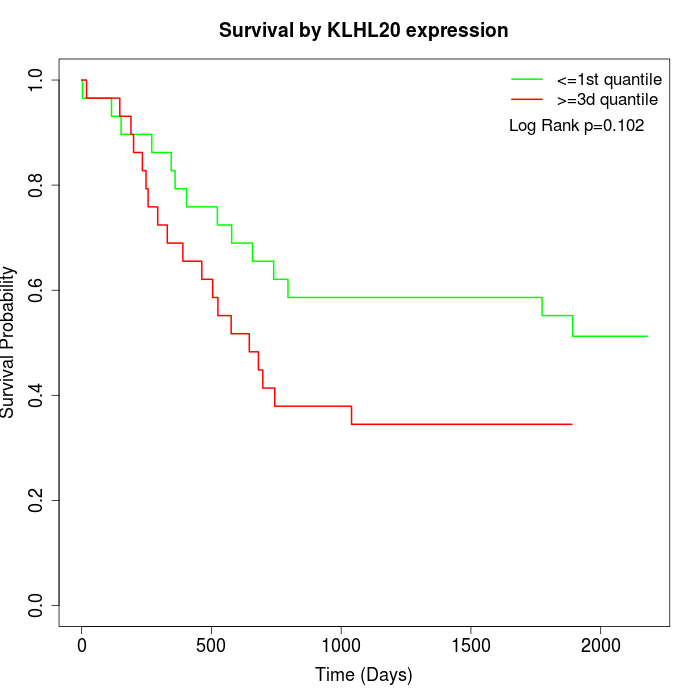 |  |
| GSE53622 | GSE53624 | TCGA |
Note: Click image to view full size file.
Copy number change of KLHL20:
| Dataset | Gene | EntrezID | Gain | Loss | Normal | Detail |
|---|---|---|---|---|---|---|
| GSE15526 | KLHL20 | 27252 | 12 | 0 | 18 | |
| GSE20123 | KLHL20 | 27252 | 12 | 0 | 18 | |
| GSE43470 | KLHL20 | 27252 | 7 | 2 | 34 | |
| GSE46452 | KLHL20 | 27252 | 3 | 1 | 55 | |
| GSE47630 | KLHL20 | 27252 | 14 | 0 | 26 | |
| GSE54993 | KLHL20 | 27252 | 0 | 6 | 64 | |
| GSE54994 | KLHL20 | 27252 | 15 | 0 | 38 | |
| GSE60625 | KLHL20 | 27252 | 0 | 0 | 11 | |
| GSE74703 | KLHL20 | 27252 | 7 | 2 | 27 | |
| GSE74704 | KLHL20 | 27252 | 5 | 0 | 15 | |
| TCGA | KLHL20 | 27252 | 41 | 4 | 51 |
Total number of gains: 116; Total number of losses: 15; Total Number of normals: 357.
Somatic mutations of KLHL20:
Generating mutation plots.
Highly correlated genes for KLHL20:
Showing top 20/498 corelated genes with mean PCC>0.5.
| Gene1 | Gene2 | Mean PCC | Num. Datasets | Num. PCC<0 | Num. PCC>0.5 |
|---|---|---|---|---|---|
| KLHL20 | ARID1B | 0.835426 | 3 | 0 | 3 |
| KLHL20 | BRD2 | 0.784478 | 3 | 0 | 3 |
| KLHL20 | TOMM40L | 0.780474 | 3 | 0 | 3 |
| KLHL20 | FBXL4 | 0.762498 | 3 | 0 | 3 |
| KLHL20 | ZBED6 | 0.751742 | 4 | 0 | 3 |
| KLHL20 | BLOC1S2 | 0.750618 | 3 | 0 | 3 |
| KLHL20 | SS18 | 0.749136 | 3 | 0 | 3 |
| KLHL20 | MED29 | 0.748586 | 3 | 0 | 3 |
| KLHL20 | TMEM181 | 0.743901 | 4 | 0 | 3 |
| KLHL20 | RAB21 | 0.73991 | 3 | 0 | 3 |
| KLHL20 | FAM126B | 0.739572 | 3 | 0 | 3 |
| KLHL20 | TYW3 | 0.734637 | 3 | 0 | 3 |
| KLHL20 | HECW2 | 0.733782 | 3 | 0 | 3 |
| KLHL20 | SYTL4 | 0.731251 | 3 | 0 | 3 |
| KLHL20 | ZNF583 | 0.726903 | 3 | 0 | 3 |
| KLHL20 | FYTTD1 | 0.725938 | 3 | 0 | 3 |
| KLHL20 | STXBP5 | 0.725078 | 4 | 0 | 3 |
| KLHL20 | RHBDD1 | 0.724694 | 3 | 0 | 3 |
| KLHL20 | MANEA | 0.723807 | 3 | 0 | 3 |
| KLHL20 | CUL1 | 0.719462 | 3 | 0 | 3 |
For details and further investigation, click here