| Full name: mitogen-activated protein kinase kinase 1 | Alias Symbol: MEK1|MAPKK1 | ||
| Type: protein-coding gene | Cytoband: 15q22.31 | ||
| Entrez ID: 5604 | HGNC ID: HGNC:6840 | Ensembl Gene: ENSG00000169032 | OMIM ID: 176872 |
| Related drugs: ALPELISIB, ARRY-300, AS-703988, AZD-8330, BALAMAPIMOD, BINIMETINIB, CERITINIB, CETUXIMAB, CHEMBL404939, CI-1040... [more] | |||
Screen Evidence:
| |||
MAP2K1 involved pathways:
Expression of MAP2K1:
| Dataset | Gene | EntrezID | Probe | Log2FC | Adj.pValue | Expression |
|---|---|---|---|---|---|---|
| GSE17351 | MAP2K1 | 5604 | 202670_at | -0.2488 | 0.7082 | |
| GSE20347 | MAP2K1 | 5604 | 202670_at | -0.5620 | 0.0023 | |
| GSE23400 | MAP2K1 | 5604 | 202670_at | -0.5088 | 0.0000 | |
| GSE26886 | MAP2K1 | 5604 | 202670_at | -1.5306 | 0.0000 | |
| GSE29001 | MAP2K1 | 5604 | 202670_at | -0.5427 | 0.1298 | |
| GSE38129 | MAP2K1 | 5604 | 202670_at | -0.2682 | 0.1135 | |
| GSE45670 | MAP2K1 | 5604 | 202670_at | -0.2476 | 0.2331 | |
| GSE53622 | MAP2K1 | 5604 | 64654 | -0.4468 | 0.0000 | |
| GSE53624 | MAP2K1 | 5604 | 64654 | -0.7662 | 0.0000 | |
| GSE63941 | MAP2K1 | 5604 | 202670_at | -0.0237 | 0.9641 | |
| GSE77861 | MAP2K1 | 5604 | 202670_at | -0.3432 | 0.1654 | |
| GSE97050 | MAP2K1 | 5604 | A_23_P20248 | -0.2310 | 0.5851 | |
| SRP007169 | MAP2K1 | 5604 | RNAseq | -2.0573 | 0.0000 | |
| SRP008496 | MAP2K1 | 5604 | RNAseq | -1.9279 | 0.0000 | |
| SRP064894 | MAP2K1 | 5604 | RNAseq | -0.6375 | 0.0014 | |
| SRP133303 | MAP2K1 | 5604 | RNAseq | -0.3122 | 0.0490 | |
| SRP159526 | MAP2K1 | 5604 | RNAseq | -0.6798 | 0.1154 | |
| SRP193095 | MAP2K1 | 5604 | RNAseq | -0.6480 | 0.0007 | |
| SRP219564 | MAP2K1 | 5604 | RNAseq | -0.8267 | 0.0649 | |
| TCGA | MAP2K1 | 5604 | RNAseq | 0.1095 | 0.0307 |
Upregulated datasets: 0; Downregulated datasets: 3.
Survival by MAP2K1 expression:
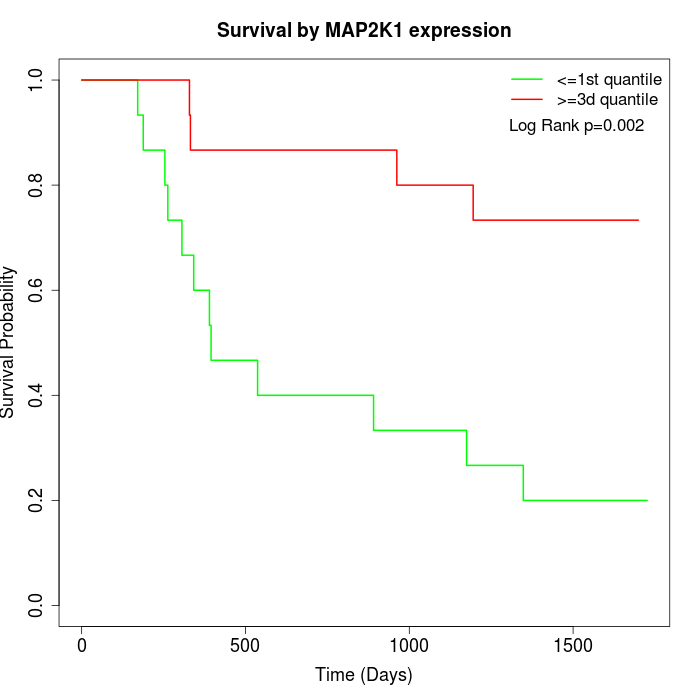 | 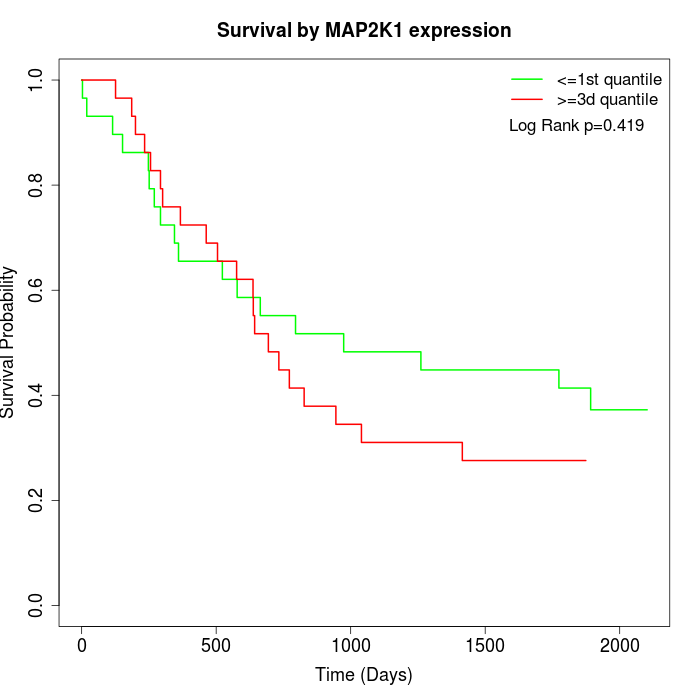 | 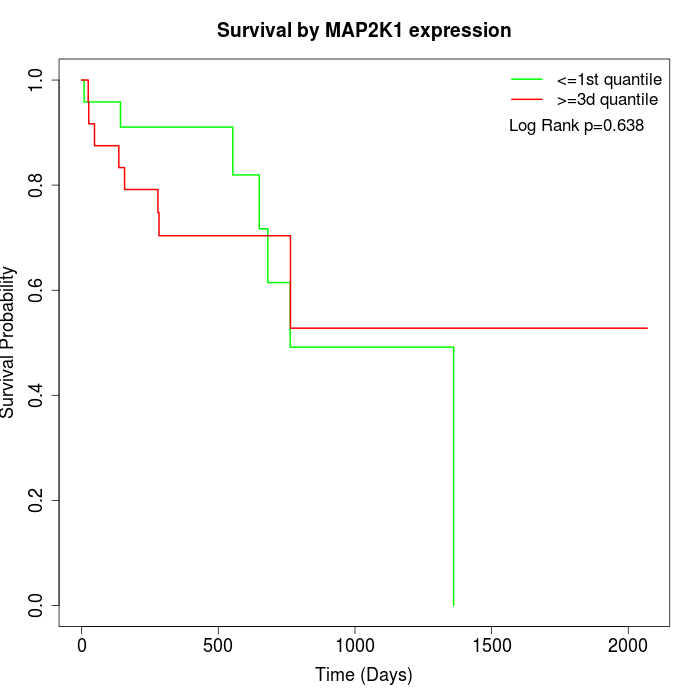 |
| GSE53622 | GSE53624 | TCGA |
Note: Click image to view full size file.
Copy number change of MAP2K1:
| Dataset | Gene | EntrezID | Gain | Loss | Normal | Detail |
|---|---|---|---|---|---|---|
| GSE15526 | MAP2K1 | 5604 | 7 | 3 | 20 | |
| GSE20123 | MAP2K1 | 5604 | 7 | 3 | 20 | |
| GSE43470 | MAP2K1 | 5604 | 4 | 6 | 33 | |
| GSE46452 | MAP2K1 | 5604 | 3 | 7 | 49 | |
| GSE47630 | MAP2K1 | 5604 | 8 | 10 | 22 | |
| GSE54993 | MAP2K1 | 5604 | 5 | 6 | 59 | |
| GSE54994 | MAP2K1 | 5604 | 6 | 7 | 40 | |
| GSE60625 | MAP2K1 | 5604 | 4 | 0 | 7 | |
| GSE74703 | MAP2K1 | 5604 | 4 | 3 | 29 | |
| GSE74704 | MAP2K1 | 5604 | 3 | 3 | 14 | |
| TCGA | MAP2K1 | 5604 | 9 | 16 | 71 |
Total number of gains: 60; Total number of losses: 64; Total Number of normals: 364.
Somatic mutations of MAP2K1:
Generating mutation plots.
Highly correlated genes for MAP2K1:
Showing top 20/1371 corelated genes with mean PCC>0.5.
| Gene1 | Gene2 | Mean PCC | Num. Datasets | Num. PCC<0 | Num. PCC>0.5 |
|---|---|---|---|---|---|
| MAP2K1 | CCNYL1 | 0.818434 | 4 | 0 | 4 |
| MAP2K1 | TBC1D20 | 0.795835 | 3 | 0 | 3 |
| MAP2K1 | PSMA5 | 0.776481 | 3 | 0 | 3 |
| MAP2K1 | SYTL4 | 0.761333 | 3 | 0 | 3 |
| MAP2K1 | CARHSP1 | 0.750367 | 9 | 0 | 9 |
| MAP2K1 | TRERF1 | 0.743204 | 4 | 0 | 3 |
| MAP2K1 | GRPEL2 | 0.742332 | 7 | 0 | 7 |
| MAP2K1 | CAPNS2 | 0.734957 | 3 | 0 | 3 |
| MAP2K1 | S100A16 | 0.734436 | 5 | 0 | 5 |
| MAP2K1 | PDIK1L | 0.734165 | 3 | 0 | 3 |
| MAP2K1 | ACTR2 | 0.733183 | 5 | 0 | 4 |
| MAP2K1 | TRIM23 | 0.731634 | 3 | 0 | 3 |
| MAP2K1 | SPPL2A | 0.728338 | 4 | 0 | 3 |
| MAP2K1 | RWDD2B | 0.727928 | 3 | 0 | 3 |
| MAP2K1 | IFNAR1 | 0.724206 | 3 | 0 | 3 |
| MAP2K1 | CTTNBP2NL | 0.721755 | 8 | 0 | 8 |
| MAP2K1 | C15orf48 | 0.719597 | 6 | 0 | 6 |
| MAP2K1 | RAB11A | 0.718179 | 12 | 0 | 12 |
| MAP2K1 | GANC | 0.718013 | 7 | 0 | 7 |
| MAP2K1 | TMED3 | 0.71738 | 10 | 0 | 10 |
For details and further investigation, click here