| Full name: mannose binding lectin 2 | Alias Symbol: COLEC1 | ||
| Type: protein-coding gene | Cytoband: 10q21.1 | ||
| Entrez ID: 4153 | HGNC ID: HGNC:6922 | Ensembl Gene: ENSG00000165471 | OMIM ID: 154545 |
| Related drugs: DANAZOL... [more] | |||
MBL2 involved pathways:
| KEGG pathway | Description | View |
|---|---|---|
| hsa04610 | Complement and coagulation cascades | |
| hsa05150 | Staphylococcus aureus infection |
Expression of MBL2:
| Dataset | Gene | EntrezID | Probe | Log2FC | Adj.pValue | Expression |
|---|---|---|---|---|---|---|
| GSE17351 | MBL2 | 4153 | 207256_at | 0.0351 | 0.8642 | |
| GSE20347 | MBL2 | 4153 | 207256_at | 0.0215 | 0.6956 | |
| GSE23400 | MBL2 | 4153 | 207256_at | -0.0693 | 0.0058 | |
| GSE26886 | MBL2 | 4153 | 207256_at | -0.0137 | 0.9180 | |
| GSE29001 | MBL2 | 4153 | 207256_at | -0.0352 | 0.7548 | |
| GSE38129 | MBL2 | 4153 | 207256_at | -0.0114 | 0.8016 | |
| GSE45670 | MBL2 | 4153 | 207256_at | -0.0770 | 0.2082 | |
| GSE63941 | MBL2 | 4153 | 207256_at | 0.1285 | 0.4363 | |
| GSE77861 | MBL2 | 4153 | 207256_at | -0.0410 | 0.6535 | |
| GSE97050 | MBL2 | 4153 | A_23_P35529 | 0.3438 | 0.6069 | |
| TCGA | MBL2 | 4153 | RNAseq | 1.5780 | 0.1482 |
Upregulated datasets: 0; Downregulated datasets: 0.
Survival by MBL2 expression:
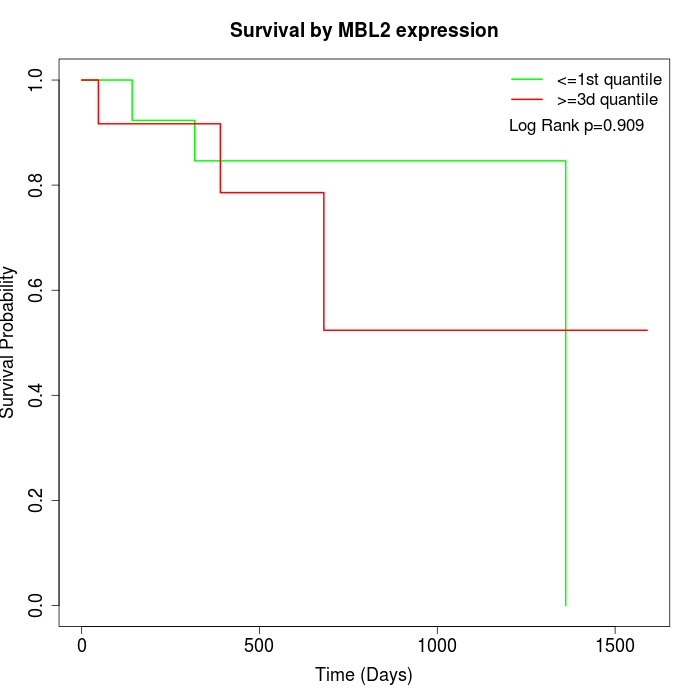 |
| TCGA |
Note: Click image to view full size file.
Copy number change of MBL2:
| Dataset | Gene | EntrezID | Gain | Loss | Normal | Detail |
|---|---|---|---|---|---|---|
| GSE15526 | MBL2 | 4153 | 3 | 5 | 22 | |
| GSE20123 | MBL2 | 4153 | 3 | 5 | 22 | |
| GSE43470 | MBL2 | 4153 | 2 | 5 | 36 | |
| GSE46452 | MBL2 | 4153 | 0 | 13 | 46 | |
| GSE47630 | MBL2 | 4153 | 4 | 12 | 24 | |
| GSE54993 | MBL2 | 4153 | 9 | 0 | 61 | |
| GSE54994 | MBL2 | 4153 | 2 | 10 | 41 | |
| GSE60625 | MBL2 | 4153 | 0 | 0 | 11 | |
| GSE74703 | MBL2 | 4153 | 2 | 3 | 31 | |
| GSE74704 | MBL2 | 4153 | 1 | 4 | 15 | |
| TCGA | MBL2 | 4153 | 12 | 22 | 62 |
Total number of gains: 38; Total number of losses: 79; Total Number of normals: 371.
Somatic mutations of MBL2:
Generating mutation plots.
Highly correlated genes for MBL2:
Showing top 20/167 corelated genes with mean PCC>0.5.
| Gene1 | Gene2 | Mean PCC | Num. Datasets | Num. PCC<0 | Num. PCC>0.5 |
|---|---|---|---|---|---|
| MBL2 | IL18BP | 0.73589 | 3 | 0 | 3 |
| MBL2 | NOL4 | 0.717548 | 3 | 0 | 3 |
| MBL2 | HPX | 0.715147 | 3 | 0 | 3 |
| MBL2 | CAPN13 | 0.710654 | 3 | 0 | 3 |
| MBL2 | LCE3D | 0.701671 | 3 | 0 | 3 |
| MBL2 | NR0B2 | 0.694124 | 3 | 0 | 3 |
| MBL2 | RNF17 | 0.692584 | 3 | 0 | 3 |
| MBL2 | ADAMTS6 | 0.68968 | 3 | 0 | 3 |
| MBL2 | LEFTY1 | 0.675618 | 3 | 0 | 3 |
| MBL2 | FOXN3-AS2 | 0.674589 | 4 | 0 | 3 |
| MBL2 | CBLN1 | 0.672133 | 3 | 0 | 3 |
| MBL2 | PIWIL2 | 0.671115 | 3 | 0 | 3 |
| MBL2 | ARMC4 | 0.670828 | 3 | 0 | 3 |
| MBL2 | C3orf36 | 0.668077 | 3 | 0 | 3 |
| MBL2 | CRISP1 | 0.657997 | 3 | 0 | 3 |
| MBL2 | ALOXE3 | 0.657515 | 4 | 0 | 3 |
| MBL2 | CHRNB4 | 0.655093 | 3 | 0 | 3 |
| MBL2 | MUC5AC | 0.654363 | 3 | 0 | 3 |
| MBL2 | IFNA4 | 0.653192 | 3 | 0 | 3 |
| MBL2 | CPA2 | 0.650802 | 3 | 0 | 3 |
For details and further investigation, click here