| Full name: late cornified envelope 3D | Alias Symbol: LEP16 | ||
| Type: protein-coding gene | Cytoband: 1q21.3 | ||
| Entrez ID: 84648 | HGNC ID: HGNC:16615 | Ensembl Gene: ENSG00000163202 | OMIM ID: 612616 |
Screen Evidence:
| |||
Expression of LCE3D:
| Dataset | Gene | EntrezID | Probe | Log2FC | Adj.pValue | Expression |
|---|---|---|---|---|---|---|
| GSE17351 | LCE3D | 84648 | 224328_s_at | 0.3687 | 0.8980 | |
| GSE26886 | LCE3D | 84648 | 224328_s_at | -1.9299 | 0.0249 | |
| GSE45670 | LCE3D | 84648 | 224328_s_at | 1.4465 | 0.1228 | |
| GSE53622 | LCE3D | 84648 | 145829 | 0.0423 | 0.9142 | |
| GSE53624 | LCE3D | 84648 | 145829 | -0.5668 | 0.0112 | |
| GSE63941 | LCE3D | 84648 | 224328_s_at | 0.2951 | 0.5131 | |
| GSE77861 | LCE3D | 84648 | 224328_s_at | 0.8470 | 0.3919 | |
| GSE97050 | LCE3D | 84648 | A_23_P115519 | 1.0694 | 0.2839 | |
| SRP007169 | LCE3D | 84648 | RNAseq | -6.8214 | 0.0051 | |
| SRP064894 | LCE3D | 84648 | RNAseq | -0.3550 | 0.6949 | |
| SRP133303 | LCE3D | 84648 | RNAseq | -2.3841 | 0.0073 | |
| SRP159526 | LCE3D | 84648 | RNAseq | -1.7903 | 0.3505 | |
| TCGA | LCE3D | 84648 | RNAseq | 1.8528 | 0.0058 |
Upregulated datasets: 1; Downregulated datasets: 3.
Survival by LCE3D expression:
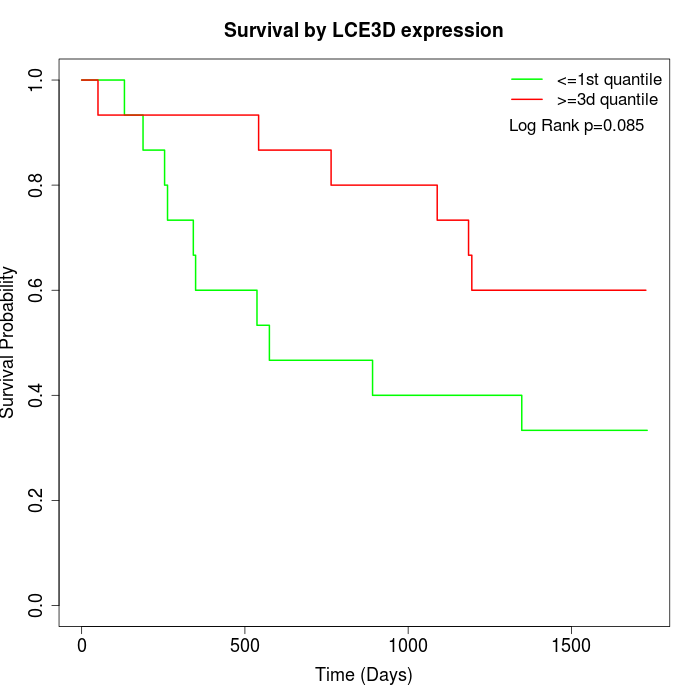 | 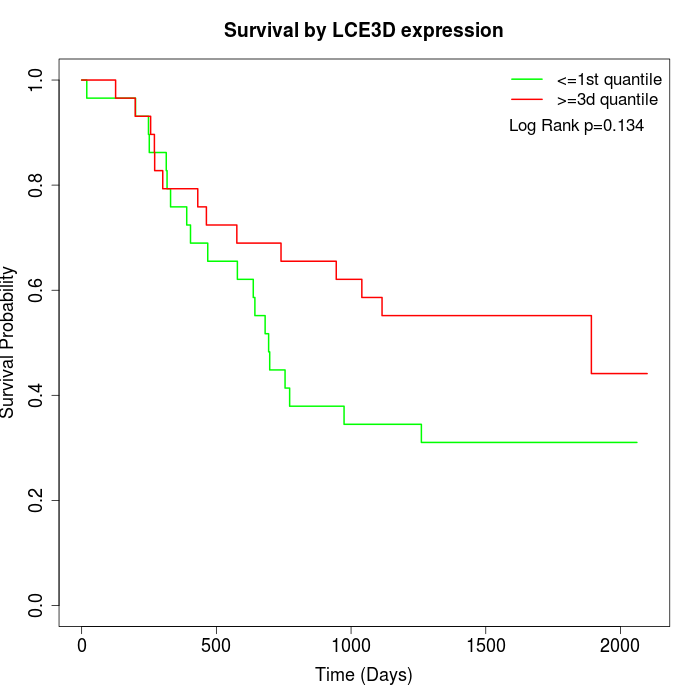 | 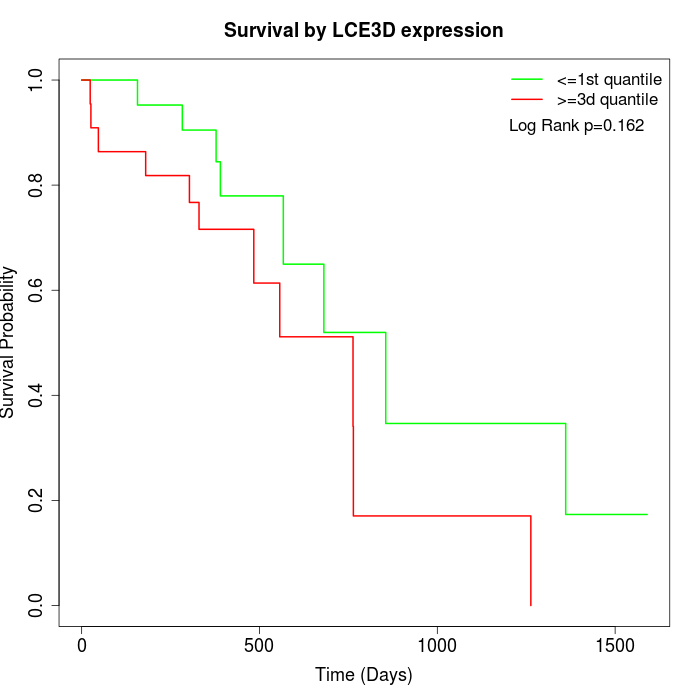 |
| GSE53622 | GSE53624 | TCGA |
Note: Click image to view full size file.
Copy number change of LCE3D:
| Dataset | Gene | EntrezID | Gain | Loss | Normal | Detail |
|---|---|---|---|---|---|---|
| GSE15526 | LCE3D | 84648 | 14 | 0 | 16 | |
| GSE20123 | LCE3D | 84648 | 14 | 0 | 16 | |
| GSE43470 | LCE3D | 84648 | 6 | 2 | 35 | |
| GSE46452 | LCE3D | 84648 | 2 | 1 | 56 | |
| GSE47630 | LCE3D | 84648 | 15 | 0 | 25 | |
| GSE54993 | LCE3D | 84648 | 0 | 4 | 66 | |
| GSE54994 | LCE3D | 84648 | 15 | 0 | 38 | |
| GSE60625 | LCE3D | 84648 | 0 | 0 | 11 | |
| GSE74703 | LCE3D | 84648 | 6 | 1 | 29 | |
| GSE74704 | LCE3D | 84648 | 7 | 0 | 13 | |
| TCGA | LCE3D | 84648 | 39 | 3 | 54 |
Total number of gains: 118; Total number of losses: 11; Total Number of normals: 359.
Somatic mutations of LCE3D:
Generating mutation plots.
Highly correlated genes for LCE3D:
Showing top 20/101 corelated genes with mean PCC>0.5.
| Gene1 | Gene2 | Mean PCC | Num. Datasets | Num. PCC<0 | Num. PCC>0.5 |
|---|---|---|---|---|---|
| LCE3D | LCE3C | 0.913146 | 3 | 0 | 3 |
| LCE3D | LCE3B | 0.906494 | 3 | 0 | 3 |
| LCE3D | LCE3E | 0.880021 | 4 | 0 | 4 |
| LCE3D | LCE3A | 0.853861 | 4 | 0 | 4 |
| LCE3D | IL36RN | 0.740558 | 5 | 0 | 5 |
| LCE3D | RABGEF1 | 0.712395 | 3 | 0 | 3 |
| LCE3D | SPRR2G | 0.704945 | 9 | 0 | 8 |
| LCE3D | MBL2 | 0.701671 | 3 | 0 | 3 |
| LCE3D | KRTDAP | 0.692418 | 8 | 0 | 7 |
| LCE3D | KRTAP20-3 | 0.686071 | 3 | 0 | 3 |
| LCE3D | ERV3-1 | 0.681957 | 3 | 0 | 3 |
| LCE3D | WFDC5 | 0.677849 | 6 | 0 | 6 |
| LCE3D | DSG1 | 0.658145 | 5 | 0 | 5 |
| LCE3D | ALOXE3 | 0.649261 | 8 | 0 | 5 |
| LCE3D | S100A12 | 0.645425 | 8 | 0 | 7 |
| LCE3D | GSDMA | 0.645047 | 4 | 0 | 4 |
| LCE3D | SPRR1B | 0.639689 | 8 | 0 | 8 |
| LCE3D | SERPINA9 | 0.637799 | 4 | 0 | 3 |
| LCE3D | KRT80 | 0.637112 | 7 | 0 | 7 |
| LCE3D | PI3 | 0.635518 | 8 | 0 | 7 |
For details and further investigation, click here