| Full name: mediator complex subunit 1 | Alias Symbol: PBP|TRAP220|RB18A|DRIP230|CRSP200|CRSP1 | ||
| Type: protein-coding gene | Cytoband: 17q12 | ||
| Entrez ID: 5469 | HGNC ID: HGNC:9234 | Ensembl Gene: ENSG00000125686 | OMIM ID: 604311 |
Screen Evidence:
| |||
Expression of MED1:
| Dataset | Gene | EntrezID | Probe | Log2FC | Adj.pValue | Expression |
|---|---|---|---|---|---|---|
| GSE17351 | MED1 | 5469 | 203497_at | 0.3468 | 0.0632 | |
| GSE20347 | MED1 | 5469 | 203497_at | 0.4819 | 0.0035 | |
| GSE23400 | MED1 | 5469 | 203496_s_at | 0.0757 | 0.1719 | |
| GSE26886 | MED1 | 5469 | 203497_at | 0.1880 | 0.6019 | |
| GSE29001 | MED1 | 5469 | 203497_at | 0.5214 | 0.0060 | |
| GSE38129 | MED1 | 5469 | 203497_at | 0.4869 | 0.0005 | |
| GSE45670 | MED1 | 5469 | 203497_at | 0.3162 | 0.2722 | |
| GSE53622 | MED1 | 5469 | 30277 | 0.6107 | 0.0000 | |
| GSE53624 | MED1 | 5469 | 30277 | 0.5393 | 0.0000 | |
| GSE63941 | MED1 | 5469 | 203497_at | 1.1253 | 0.0425 | |
| GSE77861 | MED1 | 5469 | 203497_at | 1.0732 | 0.0020 | |
| GSE97050 | MED1 | 5469 | A_33_P3210423 | 0.4363 | 0.1485 | |
| SRP007169 | MED1 | 5469 | RNAseq | 1.3074 | 0.0008 | |
| SRP008496 | MED1 | 5469 | RNAseq | 1.0048 | 0.0000 | |
| SRP064894 | MED1 | 5469 | RNAseq | 0.0593 | 0.7530 | |
| SRP133303 | MED1 | 5469 | RNAseq | 0.3816 | 0.0060 | |
| SRP159526 | MED1 | 5469 | RNAseq | 0.1678 | 0.4678 | |
| SRP193095 | MED1 | 5469 | RNAseq | 0.2333 | 0.0014 | |
| SRP219564 | MED1 | 5469 | RNAseq | -0.1820 | 0.4710 | |
| TCGA | MED1 | 5469 | RNAseq | 0.0492 | 0.3185 |
Upregulated datasets: 4; Downregulated datasets: 0.
Survival by MED1 expression:
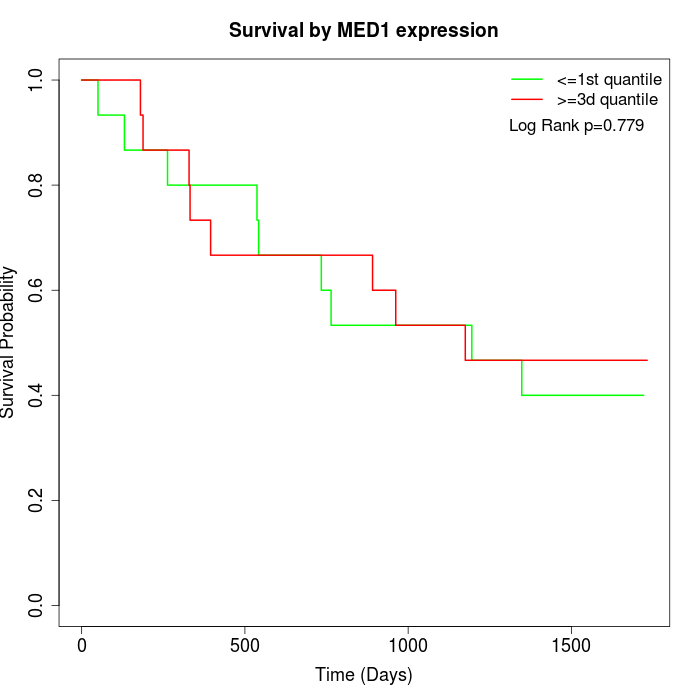 | 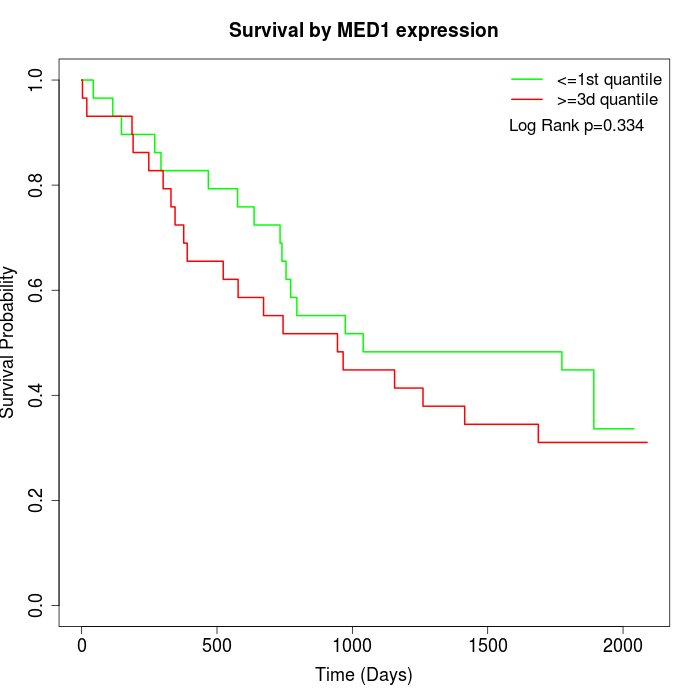 | 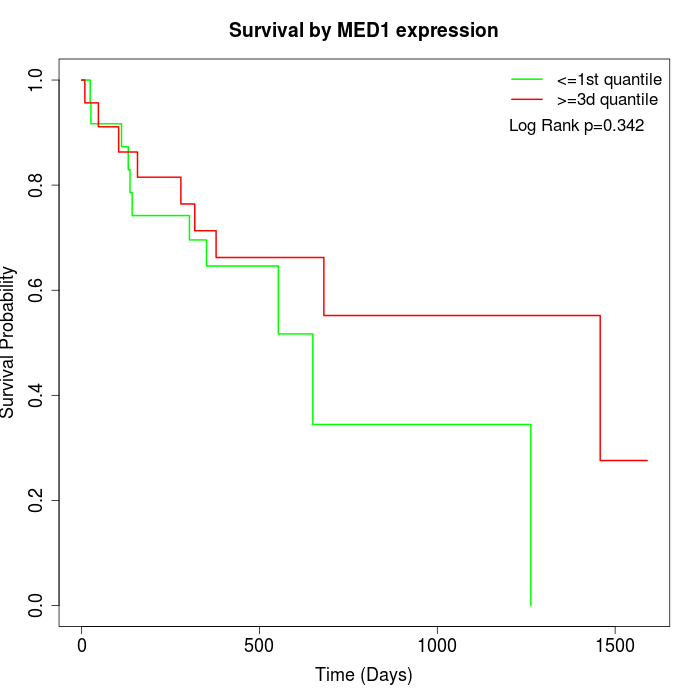 |
| GSE53622 | GSE53624 | TCGA |
Note: Click image to view full size file.
Copy number change of MED1:
| Dataset | Gene | EntrezID | Gain | Loss | Normal | Detail |
|---|---|---|---|---|---|---|
| GSE15526 | MED1 | 5469 | 8 | 1 | 21 | |
| GSE20123 | MED1 | 5469 | 8 | 1 | 21 | |
| GSE43470 | MED1 | 5469 | 1 | 1 | 41 | |
| GSE46452 | MED1 | 5469 | 34 | 0 | 25 | |
| GSE47630 | MED1 | 5469 | 8 | 1 | 31 | |
| GSE54993 | MED1 | 5469 | 3 | 4 | 63 | |
| GSE54994 | MED1 | 5469 | 8 | 5 | 40 | |
| GSE60625 | MED1 | 5469 | 4 | 0 | 7 | |
| GSE74703 | MED1 | 5469 | 1 | 0 | 35 | |
| GSE74704 | MED1 | 5469 | 5 | 1 | 14 | |
| TCGA | MED1 | 5469 | 20 | 8 | 68 |
Total number of gains: 100; Total number of losses: 22; Total Number of normals: 366.
Somatic mutations of MED1:
Generating mutation plots.
Highly correlated genes for MED1:
Showing top 20/1551 corelated genes with mean PCC>0.5.
| Gene1 | Gene2 | Mean PCC | Num. Datasets | Num. PCC<0 | Num. PCC>0.5 |
|---|---|---|---|---|---|
| MED1 | SRSF6 | 0.781503 | 3 | 0 | 3 |
| MED1 | ALG1 | 0.77489 | 3 | 0 | 3 |
| MED1 | RAB34 | 0.752482 | 3 | 0 | 3 |
| MED1 | ZZZ3 | 0.748696 | 3 | 0 | 3 |
| MED1 | RNF145 | 0.745344 | 3 | 0 | 3 |
| MED1 | CMTM4 | 0.743697 | 4 | 0 | 4 |
| MED1 | PYCR2 | 0.741596 | 3 | 0 | 3 |
| MED1 | FRA10AC1 | 0.737442 | 3 | 0 | 3 |
| MED1 | ALKBH6 | 0.736408 | 3 | 0 | 3 |
| MED1 | PTCD1 | 0.734152 | 3 | 0 | 3 |
| MED1 | PPTC7 | 0.733561 | 4 | 0 | 4 |
| MED1 | SASS6 | 0.732385 | 4 | 0 | 4 |
| MED1 | ZNF830 | 0.731214 | 4 | 0 | 4 |
| MED1 | GAS2L1 | 0.730279 | 3 | 0 | 3 |
| MED1 | BCL9 | 0.727834 | 3 | 0 | 3 |
| MED1 | UBR1 | 0.727109 | 3 | 0 | 3 |
| MED1 | NAF1 | 0.725561 | 3 | 0 | 3 |
| MED1 | SLC35B2 | 0.724258 | 3 | 0 | 3 |
| MED1 | STRN4 | 0.723075 | 3 | 0 | 3 |
| MED1 | YWHAG | 0.720753 | 5 | 0 | 4 |
For details and further investigation, click here