| Full name: Meis homeobox 3 | Alias Symbol: MRG2|DKFZp547H236 | ||
| Type: protein-coding gene | Cytoband: 19q13.32 | ||
| Entrez ID: 56917 | HGNC ID: HGNC:29537 | Ensembl Gene: ENSG00000105419 | OMIM ID: |
Expression of MEIS3:
| Dataset | Gene | EntrezID | Probe | Log2FC | Adj.pValue | Expression |
|---|---|---|---|---|---|---|
| GSE17351 | MEIS3 | 56917 | 228327_x_at | 0.0242 | 0.9581 | |
| GSE26886 | MEIS3 | 56917 | 228327_x_at | 0.3109 | 0.0246 | |
| GSE45670 | MEIS3 | 56917 | 228327_x_at | -0.1788 | 0.0331 | |
| GSE53622 | MEIS3 | 56917 | 37099 | -0.0121 | 0.9216 | |
| GSE53624 | MEIS3 | 56917 | 37099 | 0.3922 | 0.0000 | |
| GSE63941 | MEIS3 | 56917 | 228327_x_at | -0.5128 | 0.0517 | |
| GSE77861 | MEIS3 | 56917 | 228327_x_at | 0.0162 | 0.9377 | |
| GSE97050 | MEIS3 | 56917 | A_23_P78795 | -0.3917 | 0.3950 | |
| SRP007169 | MEIS3 | 56917 | RNAseq | 4.9345 | 0.0000 | |
| SRP008496 | MEIS3 | 56917 | RNAseq | 4.4170 | 0.0000 | |
| SRP064894 | MEIS3 | 56917 | RNAseq | 0.9524 | 0.0226 | |
| SRP133303 | MEIS3 | 56917 | RNAseq | 0.2930 | 0.4647 | |
| SRP159526 | MEIS3 | 56917 | RNAseq | 0.5310 | 0.2700 | |
| SRP219564 | MEIS3 | 56917 | RNAseq | -0.0519 | 0.9300 | |
| TCGA | MEIS3 | 56917 | RNAseq | -0.0173 | 0.9263 |
Upregulated datasets: 2; Downregulated datasets: 0.
Survival by MEIS3 expression:
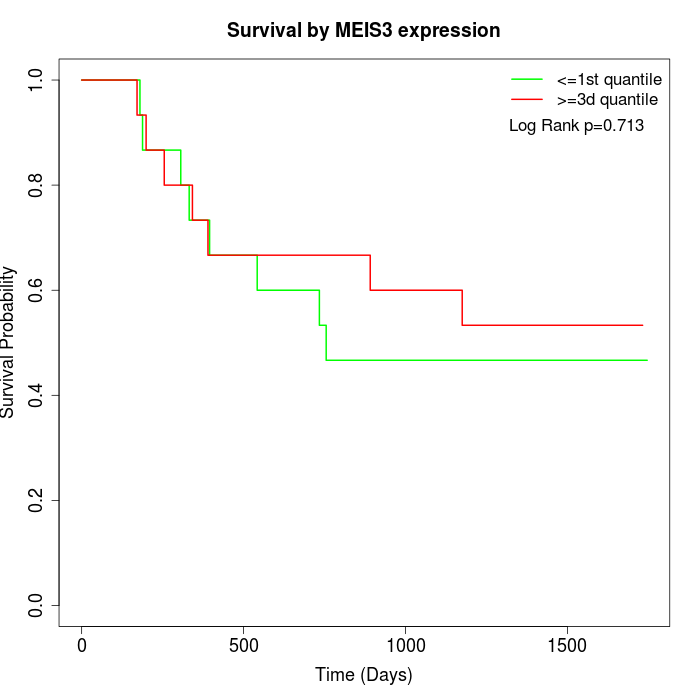 | 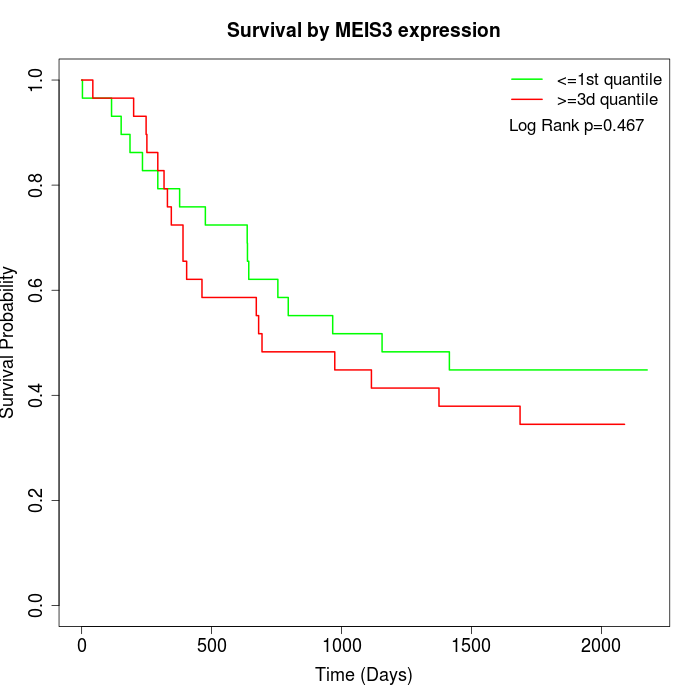 | 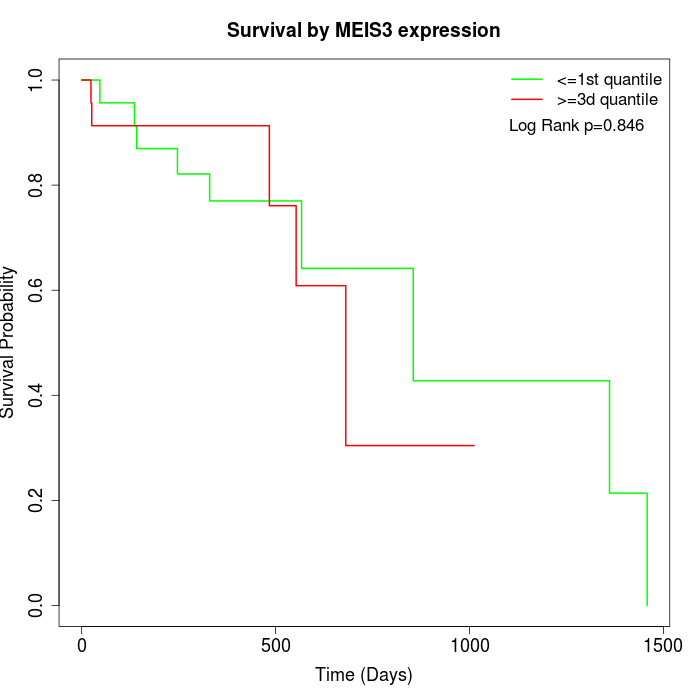 |
| GSE53622 | GSE53624 | TCGA |
Note: Click image to view full size file.
Copy number change of MEIS3:
| Dataset | Gene | EntrezID | Gain | Loss | Normal | Detail |
|---|---|---|---|---|---|---|
| GSE15526 | MEIS3 | 56917 | 4 | 4 | 22 | |
| GSE20123 | MEIS3 | 56917 | 4 | 3 | 23 | |
| GSE43470 | MEIS3 | 56917 | 3 | 10 | 30 | |
| GSE46452 | MEIS3 | 56917 | 45 | 1 | 13 | |
| GSE47630 | MEIS3 | 56917 | 8 | 7 | 25 | |
| GSE54993 | MEIS3 | 56917 | 17 | 4 | 49 | |
| GSE54994 | MEIS3 | 56917 | 4 | 14 | 35 | |
| GSE60625 | MEIS3 | 56917 | 9 | 0 | 2 | |
| GSE74703 | MEIS3 | 56917 | 3 | 7 | 26 | |
| GSE74704 | MEIS3 | 56917 | 4 | 1 | 15 | |
| TCGA | MEIS3 | 56917 | 14 | 18 | 64 |
Total number of gains: 115; Total number of losses: 69; Total Number of normals: 304.
Somatic mutations of MEIS3:
Generating mutation plots.
Highly correlated genes for MEIS3:
Showing top 20/590 corelated genes with mean PCC>0.5.
| Gene1 | Gene2 | Mean PCC | Num. Datasets | Num. PCC<0 | Num. PCC>0.5 |
|---|---|---|---|---|---|
| MEIS3 | TMEM255B | 0.785045 | 3 | 0 | 3 |
| MEIS3 | BARX1 | 0.783362 | 3 | 0 | 3 |
| MEIS3 | FIBCD1 | 0.764285 | 4 | 0 | 4 |
| MEIS3 | OGG1 | 0.75734 | 3 | 0 | 3 |
| MEIS3 | TM4SF5 | 0.755698 | 3 | 0 | 3 |
| MEIS3 | TTC9B | 0.755349 | 3 | 0 | 3 |
| MEIS3 | MAST1 | 0.750007 | 3 | 0 | 3 |
| MEIS3 | IL3RA | 0.746394 | 3 | 0 | 3 |
| MEIS3 | CHST8 | 0.745955 | 3 | 0 | 3 |
| MEIS3 | LTA | 0.745802 | 3 | 0 | 3 |
| MEIS3 | ENTPD2 | 0.745134 | 3 | 0 | 3 |
| MEIS3 | NANOS3 | 0.741836 | 3 | 0 | 3 |
| MEIS3 | ZNF771 | 0.734421 | 4 | 0 | 4 |
| MEIS3 | BCAS4 | 0.728924 | 4 | 0 | 4 |
| MEIS3 | AP2A2 | 0.728275 | 4 | 0 | 4 |
| MEIS3 | TGFB1I1 | 0.724742 | 4 | 0 | 4 |
| MEIS3 | VAMP2 | 0.722928 | 3 | 0 | 3 |
| MEIS3 | DDIT3 | 0.715589 | 3 | 0 | 3 |
| MEIS3 | CRYBB2 | 0.713839 | 3 | 0 | 3 |
| MEIS3 | IL17F | 0.708063 | 3 | 0 | 3 |
For details and further investigation, click here