| Full name: microtubule associated serine/threonine kinase 1 | Alias Symbol: SAST|KIAA0973 | ||
| Type: protein-coding gene | Cytoband: 19p13.2 | ||
| Entrez ID: 22983 | HGNC ID: HGNC:19034 | Ensembl Gene: ENSG00000105613 | OMIM ID: 612256 |
Expression of MAST1:
| Dataset | Gene | EntrezID | Probe | Log2FC | Adj.pValue | Expression |
|---|---|---|---|---|---|---|
| GSE17351 | MAST1 | 22983 | 217231_s_at | 0.1392 | 0.7379 | |
| GSE20347 | MAST1 | 22983 | 217231_s_at | 0.0437 | 0.6683 | |
| GSE23400 | MAST1 | 22983 | 217231_s_at | -0.0510 | 0.2102 | |
| GSE26886 | MAST1 | 22983 | 217231_s_at | 0.3389 | 0.0187 | |
| GSE29001 | MAST1 | 22983 | 217231_s_at | -0.0556 | 0.6693 | |
| GSE38129 | MAST1 | 22983 | 217231_s_at | -0.0345 | 0.7340 | |
| GSE45670 | MAST1 | 22983 | 217231_s_at | 0.3062 | 0.0042 | |
| GSE53622 | MAST1 | 22983 | 82378 | 0.2288 | 0.0092 | |
| GSE53624 | MAST1 | 22983 | 82378 | 0.4021 | 0.0000 | |
| GSE63941 | MAST1 | 22983 | 217231_s_at | 0.2608 | 0.0905 | |
| GSE77861 | MAST1 | 22983 | 217231_s_at | -0.0624 | 0.6295 | |
| GSE97050 | MAST1 | 22983 | A_23_P101480 | -0.0866 | 0.6808 | |
| SRP219564 | MAST1 | 22983 | RNAseq | 0.6057 | 0.3870 | |
| TCGA | MAST1 | 22983 | RNAseq | 0.4916 | 0.1068 |
Upregulated datasets: 0; Downregulated datasets: 0.
Survival by MAST1 expression:
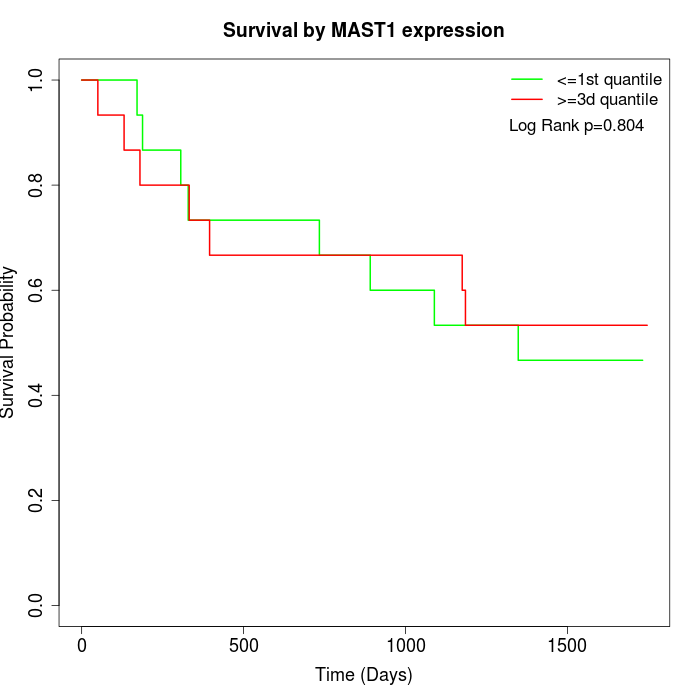 | 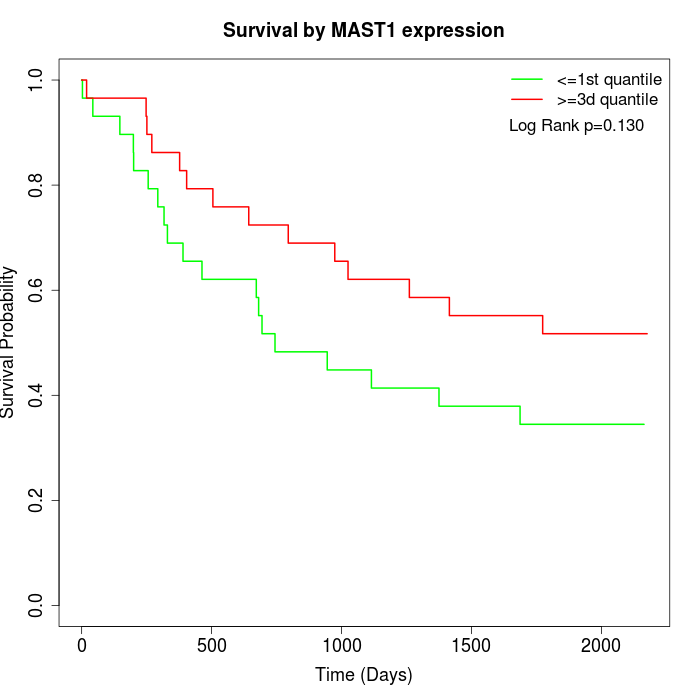 | 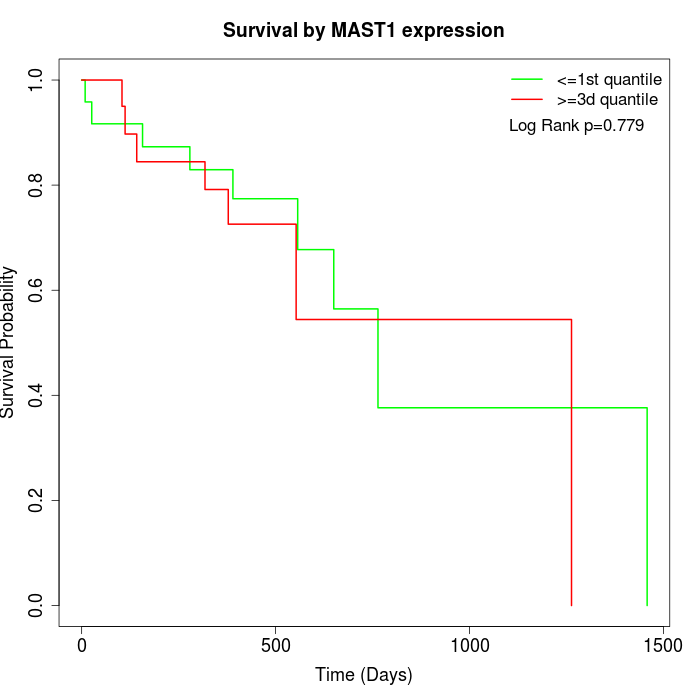 |
| GSE53622 | GSE53624 | TCGA |
Note: Click image to view full size file.
Copy number change of MAST1:
| Dataset | Gene | EntrezID | Gain | Loss | Normal | Detail |
|---|---|---|---|---|---|---|
| GSE15526 | MAST1 | 22983 | 4 | 2 | 24 | |
| GSE20123 | MAST1 | 22983 | 3 | 1 | 26 | |
| GSE43470 | MAST1 | 22983 | 2 | 6 | 35 | |
| GSE46452 | MAST1 | 22983 | 47 | 1 | 11 | |
| GSE47630 | MAST1 | 22983 | 4 | 7 | 29 | |
| GSE54993 | MAST1 | 22983 | 16 | 3 | 51 | |
| GSE54994 | MAST1 | 22983 | 8 | 13 | 32 | |
| GSE60625 | MAST1 | 22983 | 9 | 0 | 2 | |
| GSE74703 | MAST1 | 22983 | 2 | 4 | 30 | |
| GSE74704 | MAST1 | 22983 | 0 | 1 | 19 | |
| TCGA | MAST1 | 22983 | 16 | 13 | 67 |
Total number of gains: 111; Total number of losses: 51; Total Number of normals: 326.
Somatic mutations of MAST1:
Generating mutation plots.
Highly correlated genes for MAST1:
Showing top 20/394 corelated genes with mean PCC>0.5.
| Gene1 | Gene2 | Mean PCC | Num. Datasets | Num. PCC<0 | Num. PCC>0.5 |
|---|---|---|---|---|---|
| MAST1 | NFAM1 | 0.803012 | 3 | 0 | 3 |
| MAST1 | PTGES3 | 0.797305 | 3 | 0 | 3 |
| MAST1 | PCGF2 | 0.78674 | 3 | 0 | 3 |
| MAST1 | MAD2L2 | 0.762124 | 3 | 0 | 3 |
| MAST1 | MEIS3 | 0.750007 | 3 | 0 | 3 |
| MAST1 | SLC43A2 | 0.746929 | 3 | 0 | 3 |
| MAST1 | KLHDC3 | 0.746387 | 3 | 0 | 3 |
| MAST1 | RSBN1L | 0.740782 | 3 | 0 | 3 |
| MAST1 | EGLN2 | 0.738094 | 3 | 0 | 3 |
| MAST1 | GAS6-AS1 | 0.737949 | 3 | 0 | 3 |
| MAST1 | TAF6 | 0.736005 | 3 | 0 | 3 |
| MAST1 | MAPK8IP3 | 0.728878 | 3 | 0 | 3 |
| MAST1 | ARAF | 0.720756 | 4 | 0 | 3 |
| MAST1 | ITGB4 | 0.711624 | 3 | 0 | 3 |
| MAST1 | RNPS1 | 0.706312 | 3 | 0 | 3 |
| MAST1 | USP28 | 0.696724 | 3 | 0 | 3 |
| MAST1 | TCTN1 | 0.696127 | 4 | 0 | 3 |
| MAST1 | AURKAIP1 | 0.695669 | 4 | 0 | 4 |
| MAST1 | PRX | 0.69491 | 3 | 0 | 3 |
| MAST1 | LIMK1 | 0.691537 | 3 | 0 | 3 |
For details and further investigation, click here